The Cost to Replace metrics, which appear in the Isolation Cost and Time Statistics section of the Fault Isolation Report, describe the cost associated with replacing all items (using Block Replacement) for fault groups that can be isolated using the diagnostic sequence in the current diagnostic study. The currency used for this metric (e.g., US Dollars) is listed below the "Cost to Replace" header. eXpress provides six Cost to Replace metrics:
Minimum
The MinimumCost to Replace is the smallest aggregate object cost involved with replacing all items in one of the fault groups isolated by the current diagnostic sequence. If the analyst clicks on this field when viewing the Fault Isolation Report in the eXpress report viewer, it will bring up a details report describing the fault group for which this Test limit was derived.
Maximum
The MaximumCost to Replace is the largest aggregate object cost involved with replacing all items in one of the fault groups isolated by the current diagnostic sequence. If the analyst clicks on this field when viewing the Fault Isolation Report in the eXpress report viewer, it will bring up a details report describing the fault group for which this Test limit was derived.
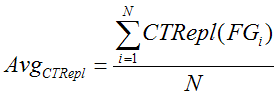
Average
The AverageCost to Replace is calculated by summing the aggregate replacement cost associated with each isolated fault group and dividing the sum by the total number of isolated fault groups:
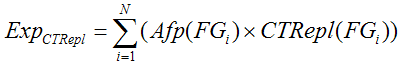
The ExpectedCost to Replace estimates the Mean Cost to Replace that would be achieved if the the current diagnostic sequence were to be employed with a fielded system. The metric is calculated by multiplying each fault group's aggregate replacement cost by the fault group's aggregate failure probability and then summing the results for all isolated fault groups:
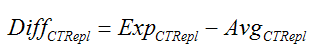
The Cost to ReplaceDifferential, which is calculated by subtracting the Average from the Expected Test limit, represents how far the expected replacement cost will deviate from the non-probability-weighted average. This can be a good indication of how well items or functions that fail frequently are being segregated from those that cost a lot to replace (a high positive differential Test limit indicates that they are well segregated, whereas a negative Test limit may indicate that they are poorly segregated). This metric, which was developed by DSI in the early 1990s, provides the analyst with information that may help identify the source of exorbitant replacement costs. This Test limit can be calculated as follows:
where
ExpCTRepl
=
the Expected Cost to Replace (defined above)
AvgCTRepl
=
the Average Cost to Replace (defined above)
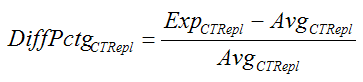
Also included is the Cost to Replace Differential Percentage, which is calculated by dividing the Cost to Replace Differential by the Average Cost to Replace: