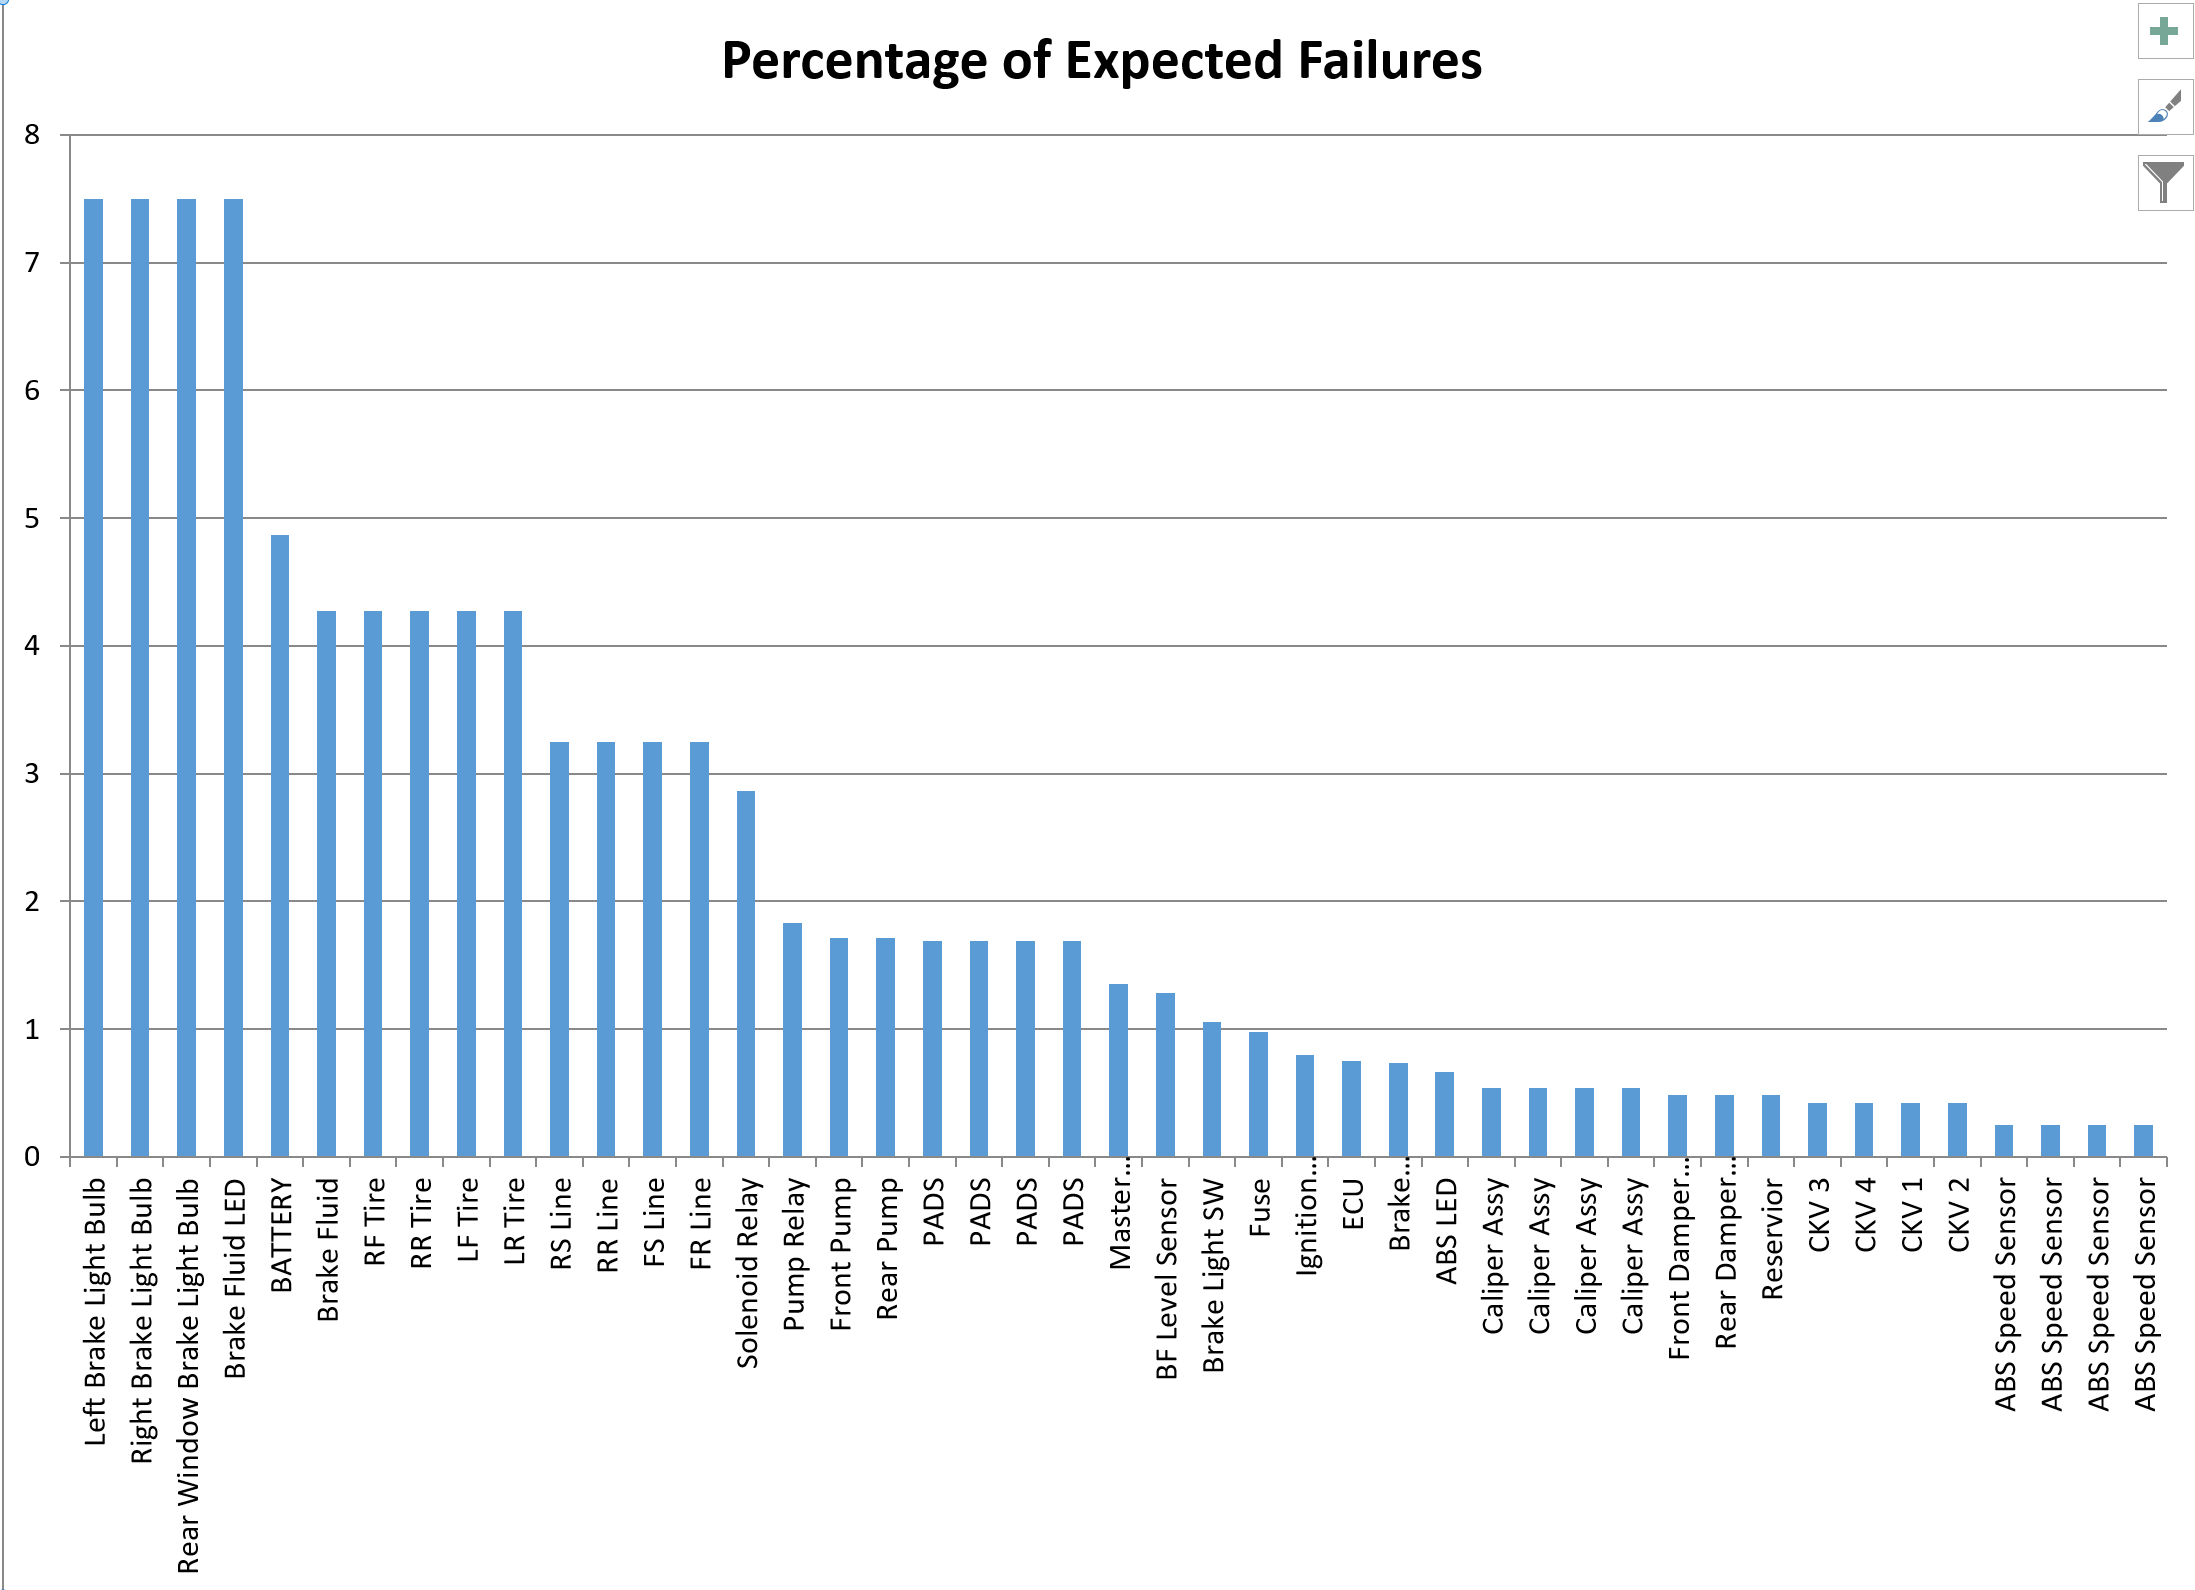
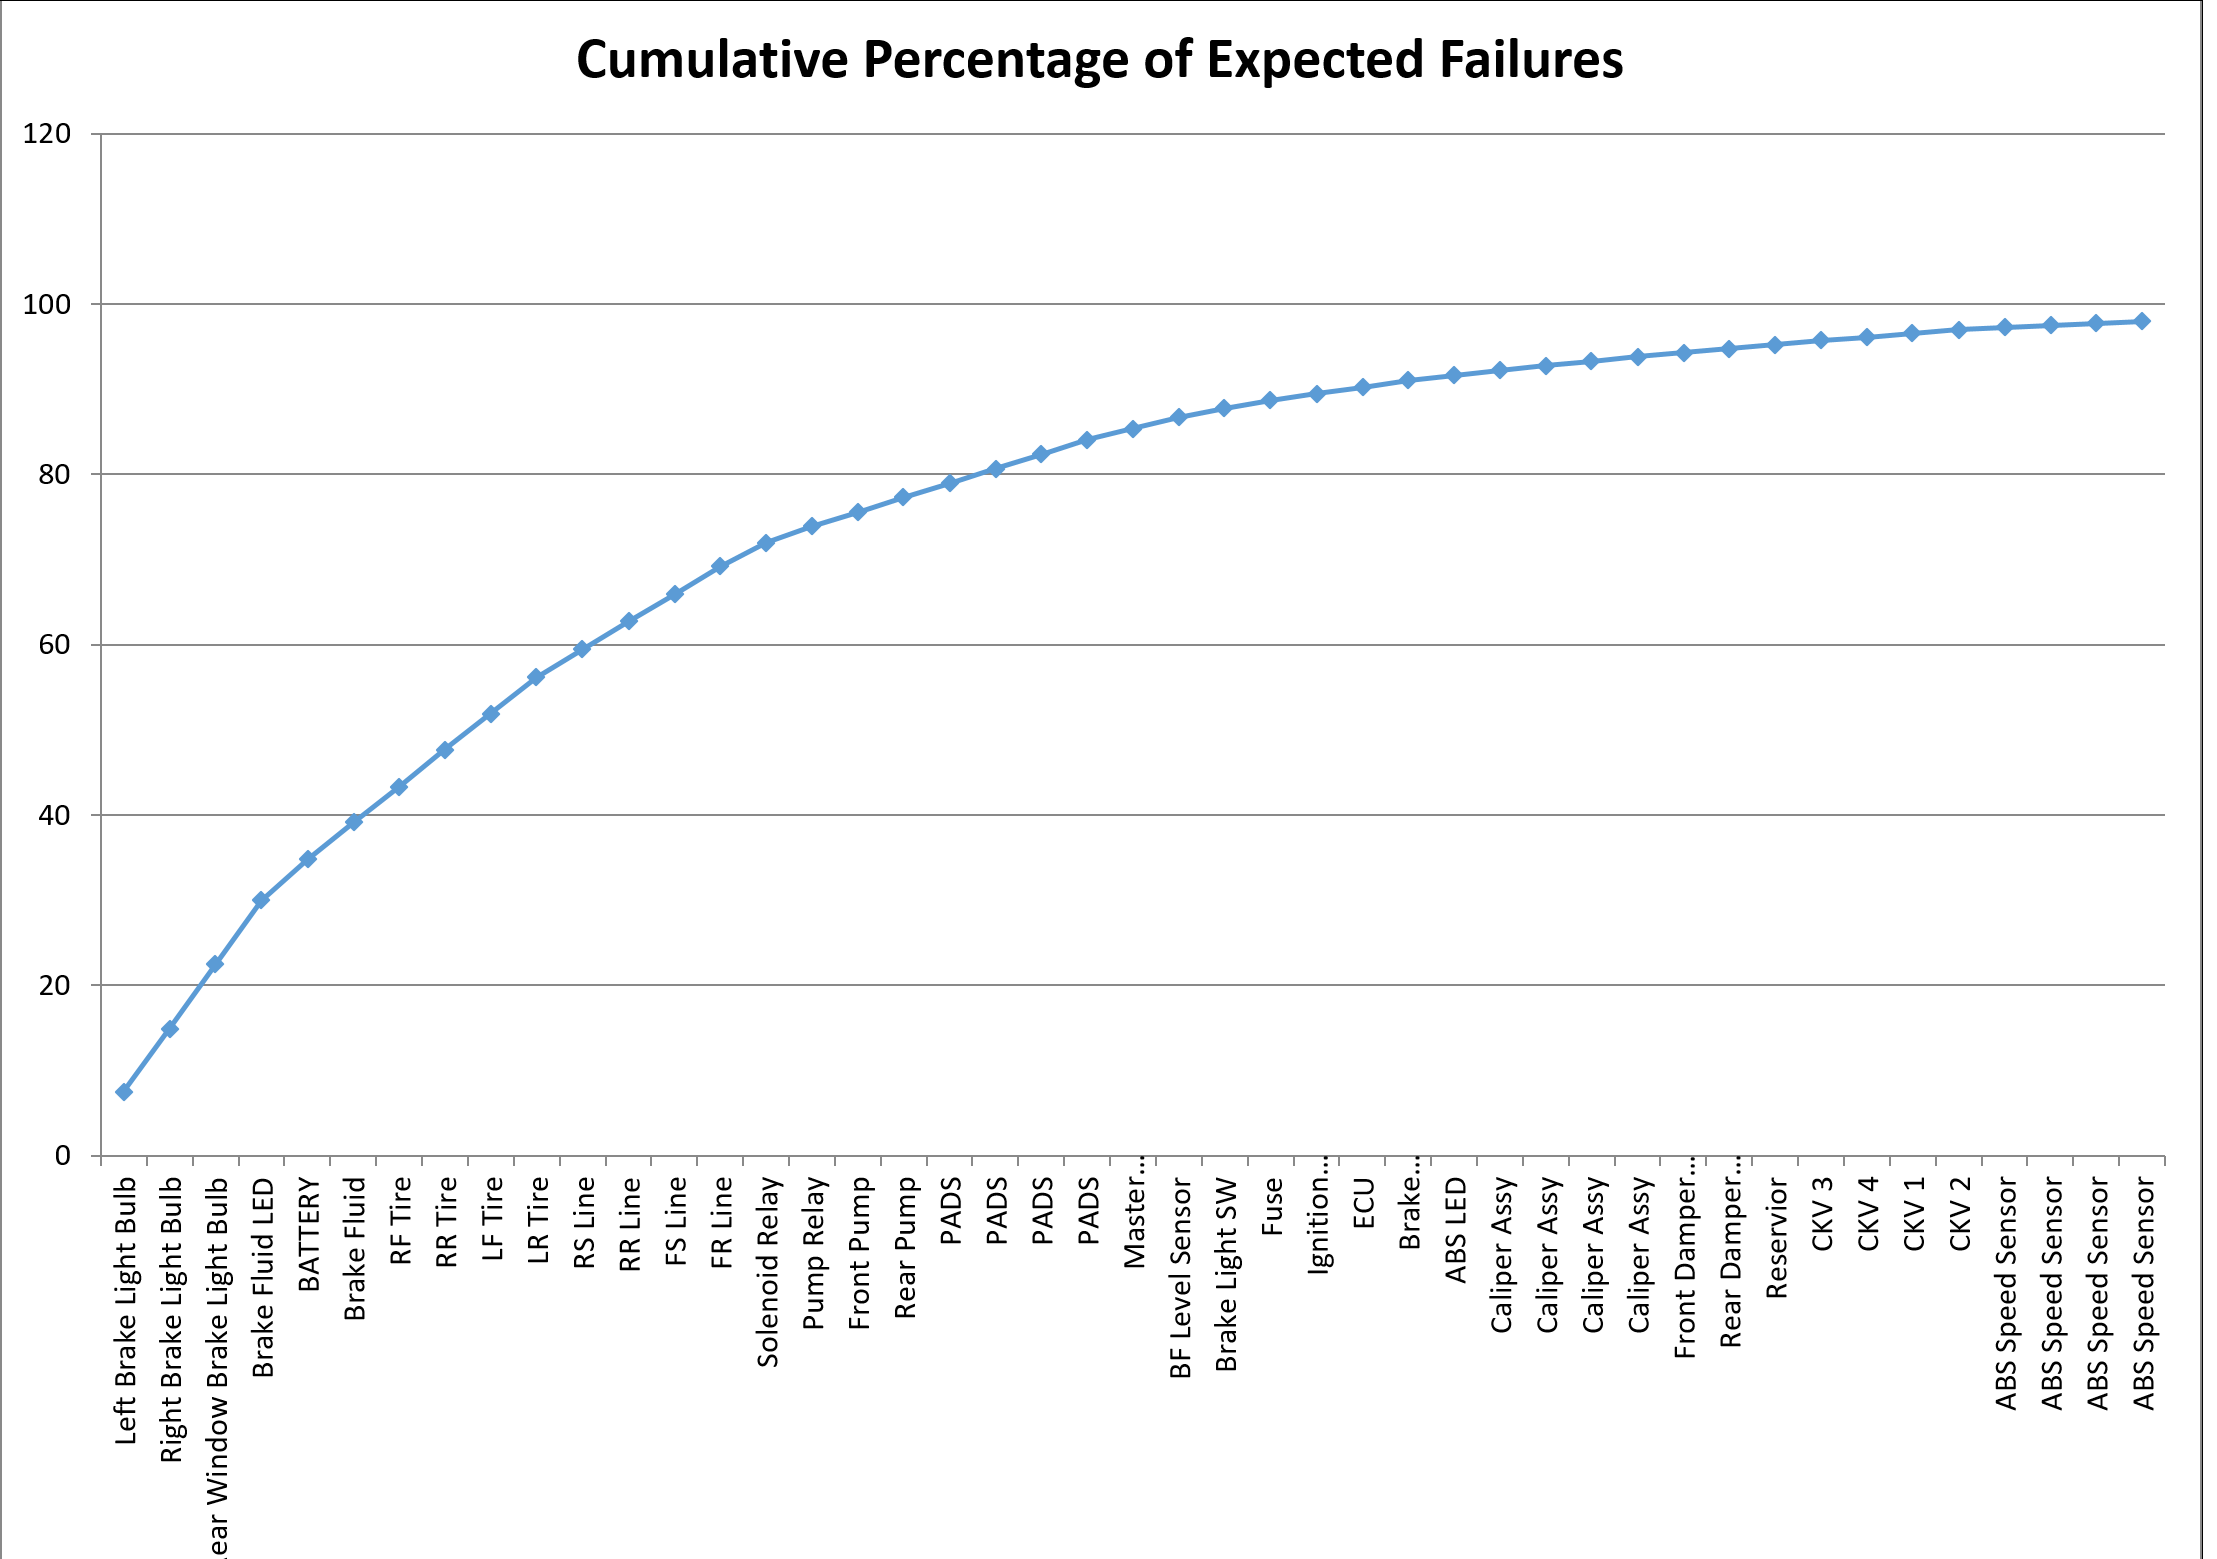
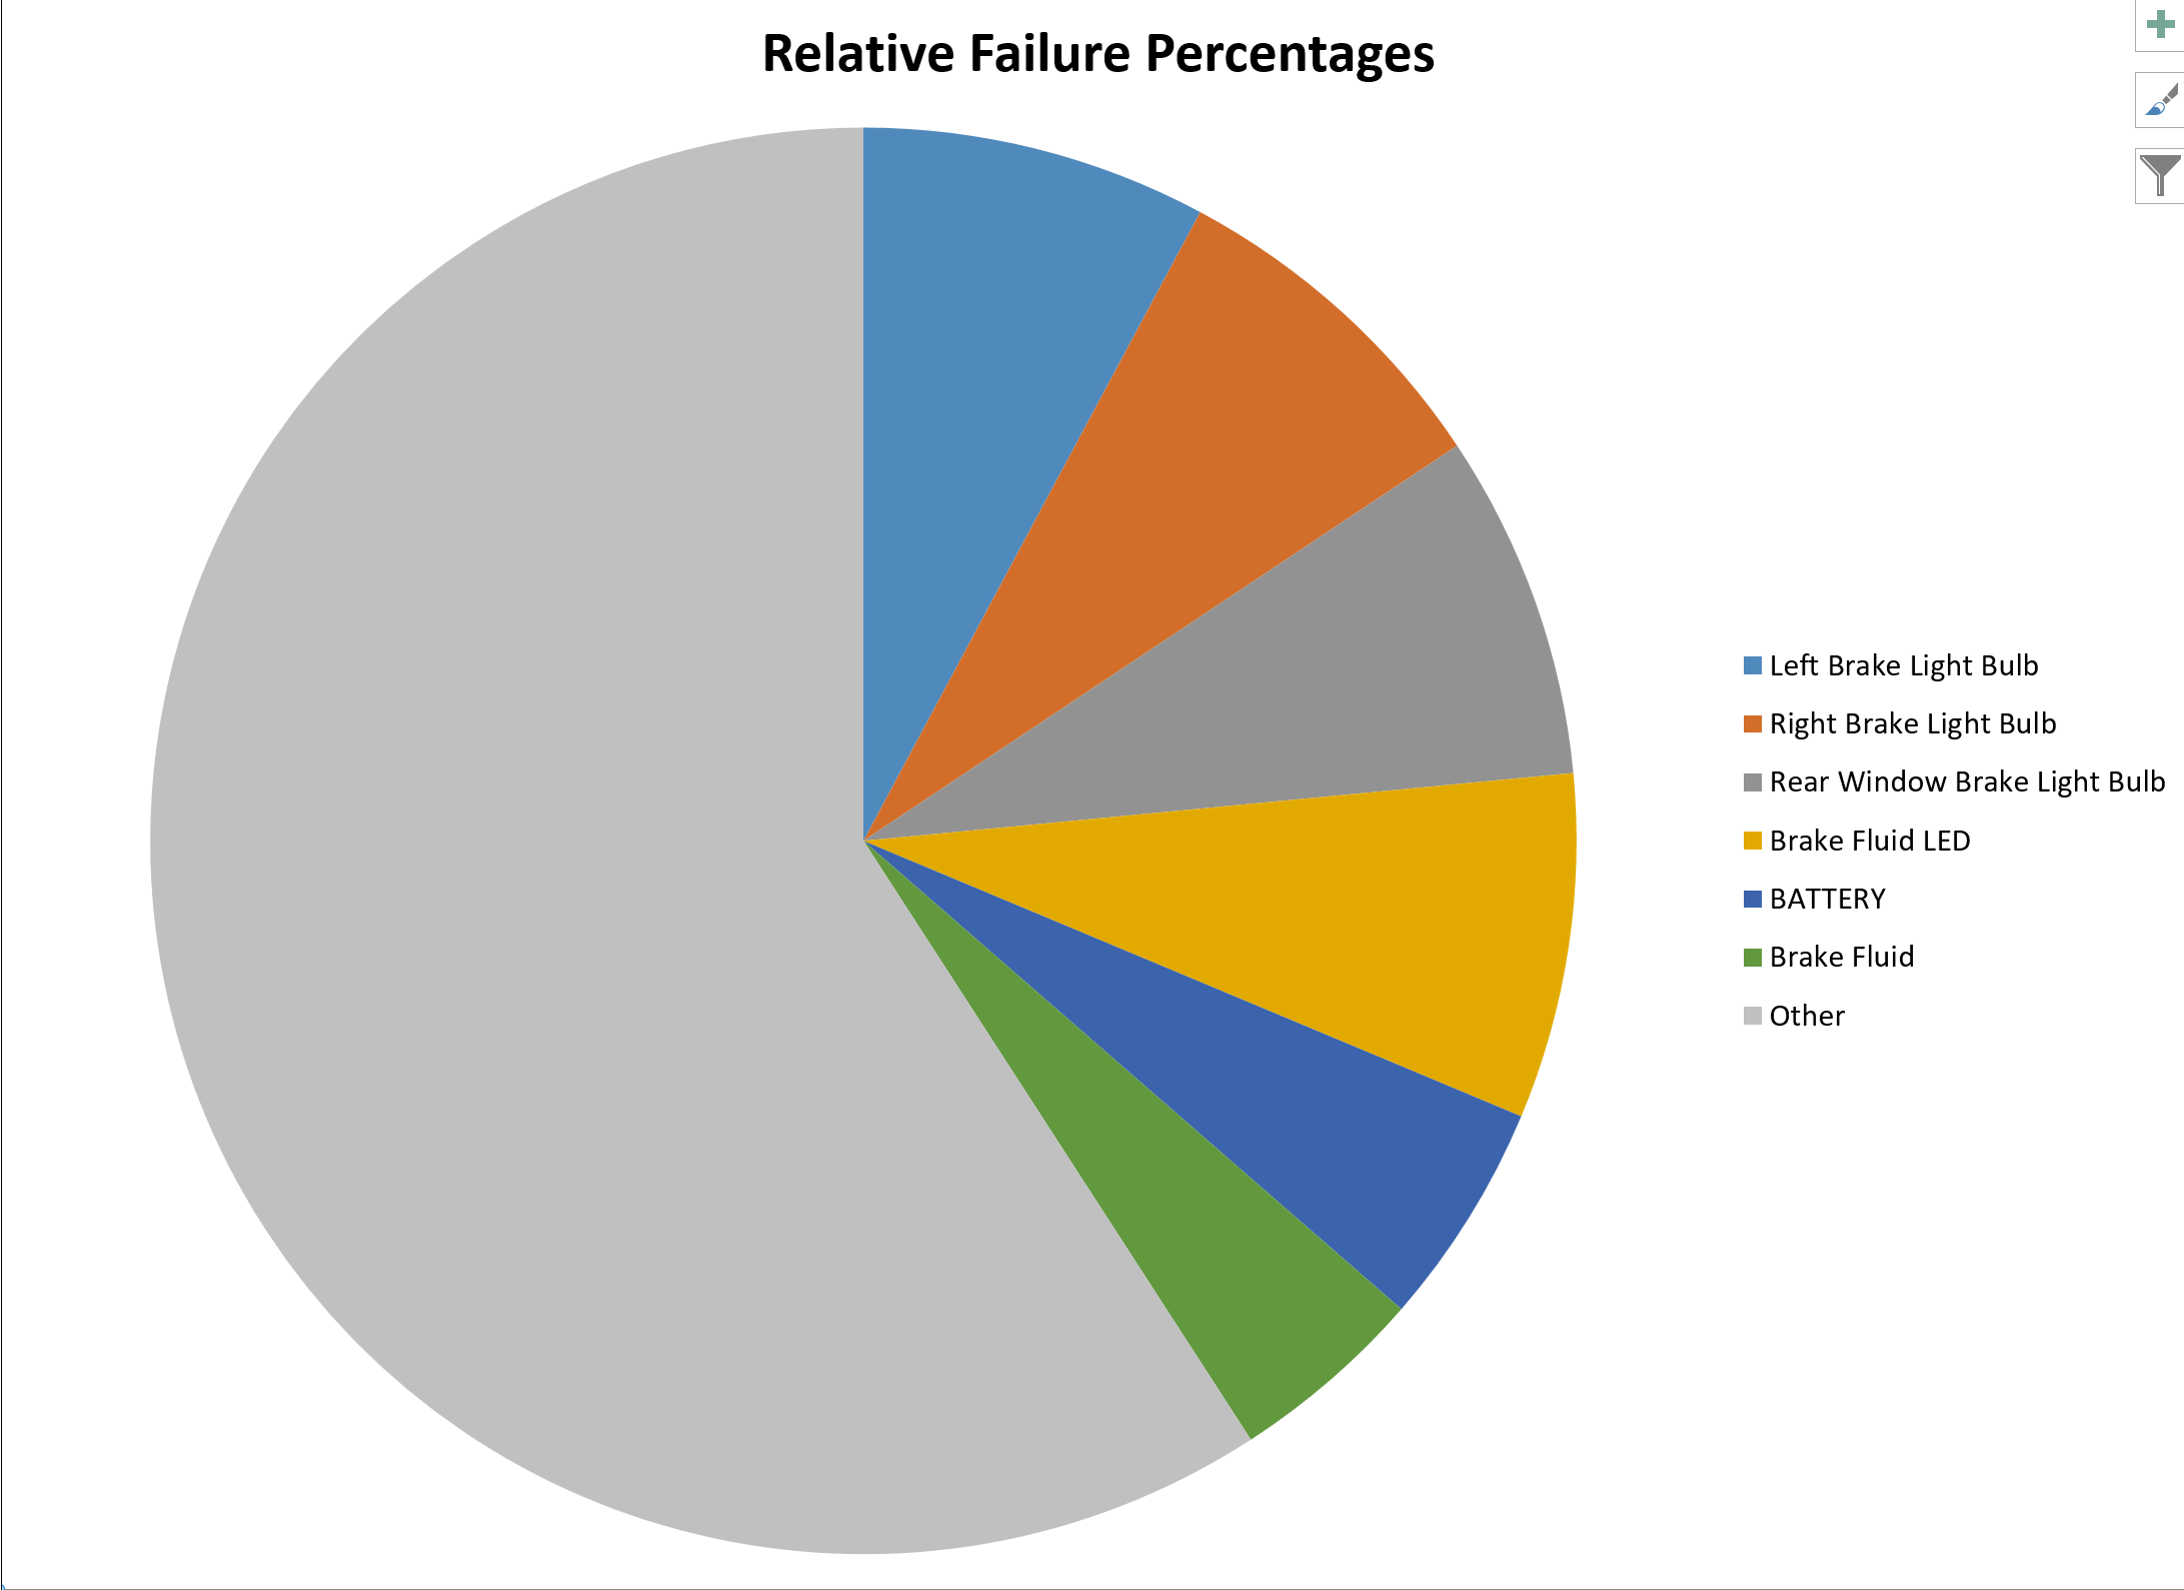
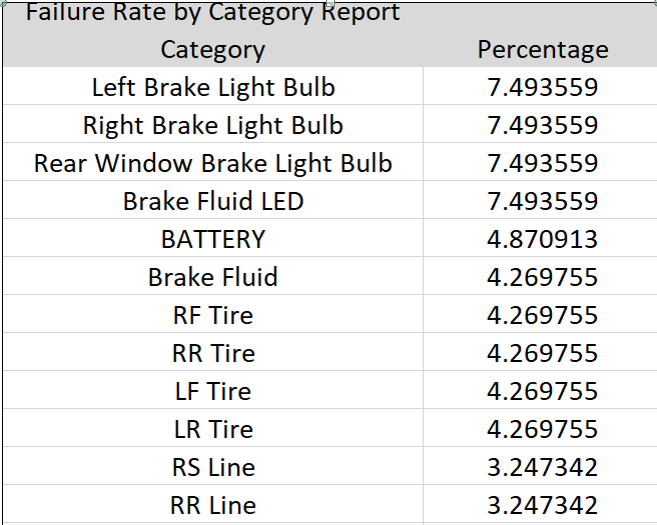
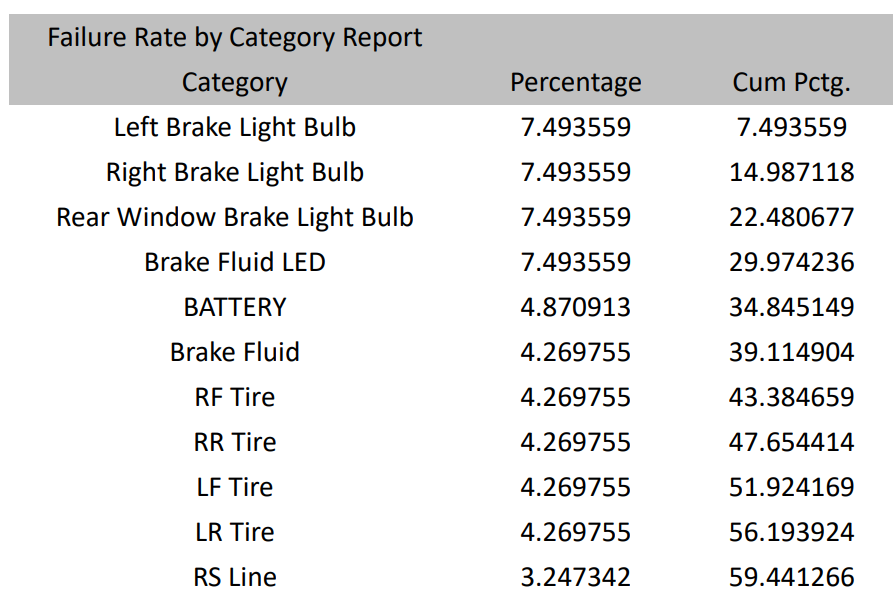
The Failure rate by Category Report varies with Hierarchical Expansion, Operating modes and Classes. Large models usually contain multiple operating modes and multiple Classes. Herein is an example of each of 3 Excel Reports showing "Percentage of Expected Failures", "Cumulative Percentage of Failures" and "Relative Failure percentages".
These three Graphical Excel reports are primarily for use by the Analyst for Design reviews of the modeling process. The above three links will show each report in full size.
"Percentage of Expected Failure Rates" and "Cumulative Percentage of Failures" can be made in no-grahical form. The above two links will show these reports.