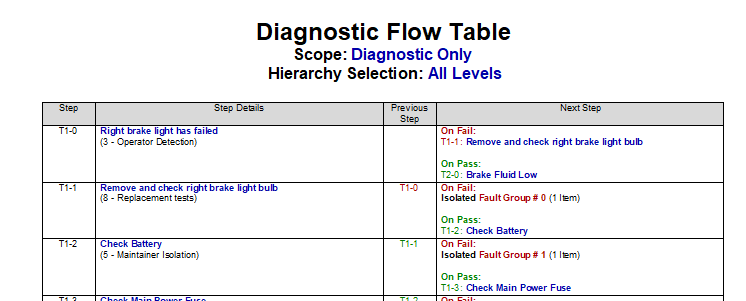
Also, in the new version of the report, the order of the outcomes has been reversed (with the “Fail” outcome coming before the “Pass” outcome). This reorganization makes the report much easier to read for multiple-outcome tests (tests that can fail in more than one way).
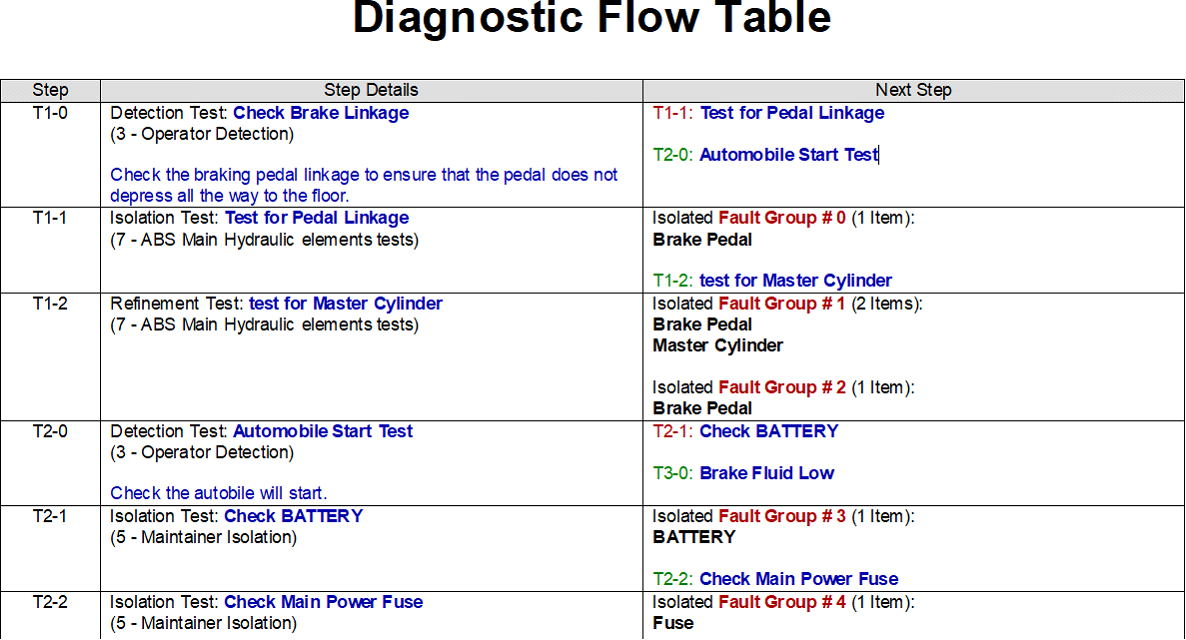
Here is another example of the RTF format of the report—this time with step types and test descriptions included (and with outcome labels and previous steps excluded):
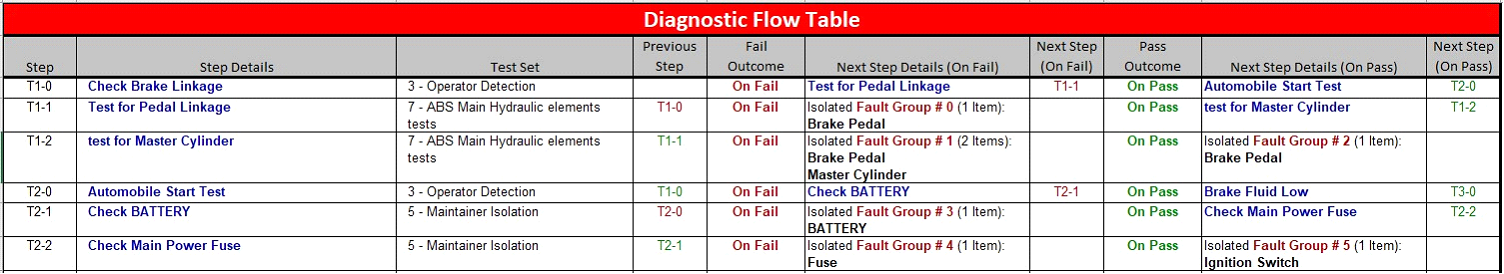
When you generate the report in MS Excel format, data is organized into separate columns to facilitate parsing by third-party software. Here’s an excerpt from the default layout in Excel:
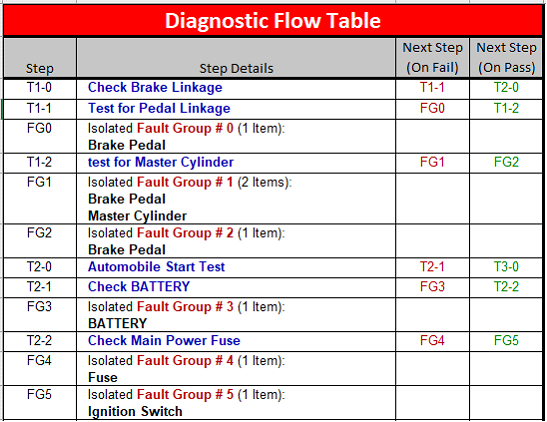
Hereis another example of the report in MS Excel format. Here the test sets, previous steps, outcome labels and next step details have all been excluded from the report. Also, the option to include fault groups in their own step has been turned on. This results in a report with a greater number of rows, but fewer columns.
Regardless of how you wish for fault groups to be presented, the Excel layout can be easily parsed, thereby offering an alternative way (other than DiagML) to export test sequences generated in eXpress.