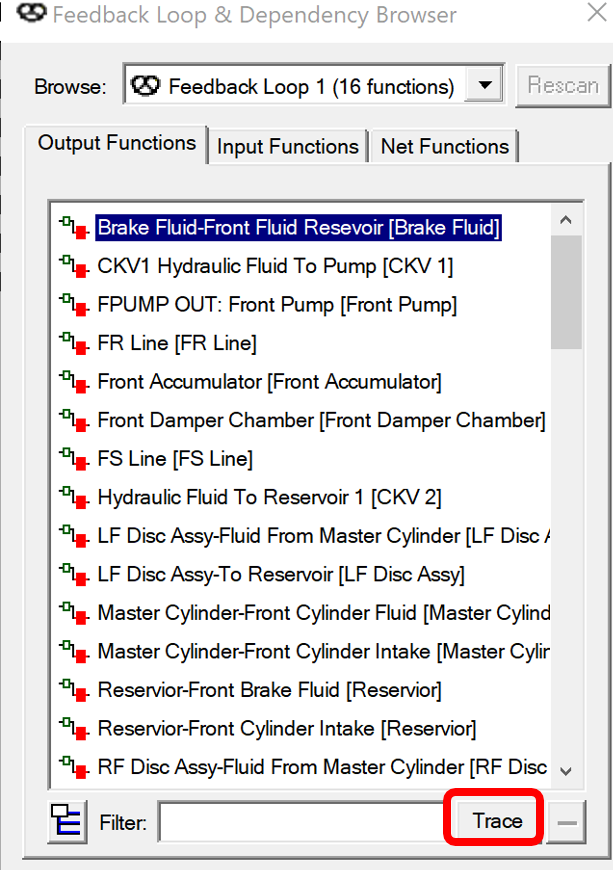
Clicking on the Trace button at the bottom of the dialog to invoke the Trace panel for the selected function. Use this panel to trace through dependencies step-by-step by clicking on the arrow buttons at the bottom.
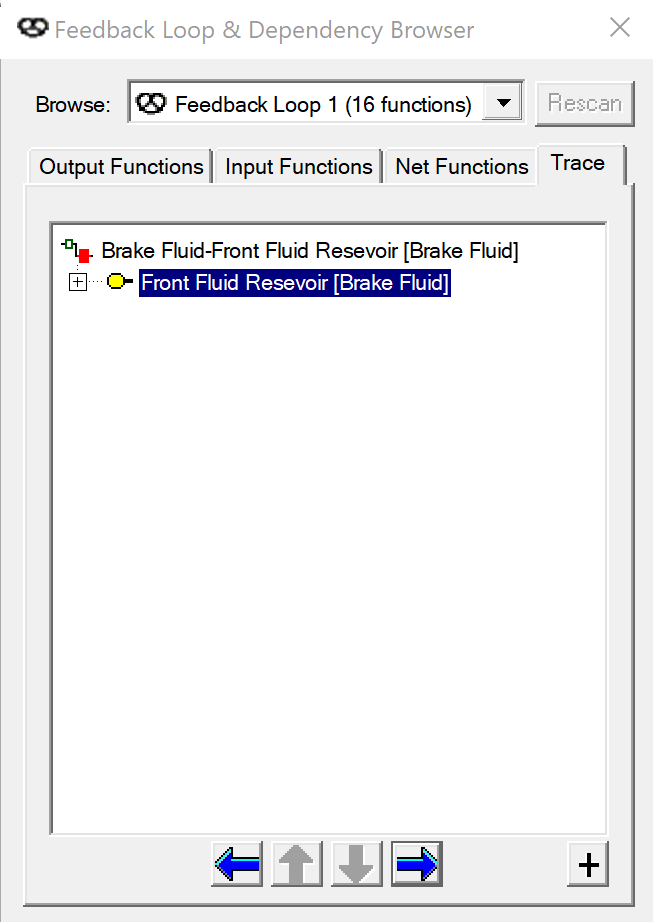
In this example, a trace was created for an output function; that function will initially be highlighted (as shown on the dialog at right). Click repeatedly on the right arrow to trace through the dependencies that comprise the loop, moving to and highlighting the input, net and output functions in the tree (as shown in the three sample dialogs below). With each step in the trace, the corresponding context panel will be displayed for the highlighted function as shown below.
Note that, as you descend into different levels of the tree, you are tracing upstreamthrough dependencies—moving from output functions to their source input ports, from input functions to their net function inputs, from net functions to the output functions that supply the signal.
When you select a dependency whose type matches the top element on the panel, the right arrow button will turn yellow. When you click on this button, the tree will be repopulated with the selected function at the top.
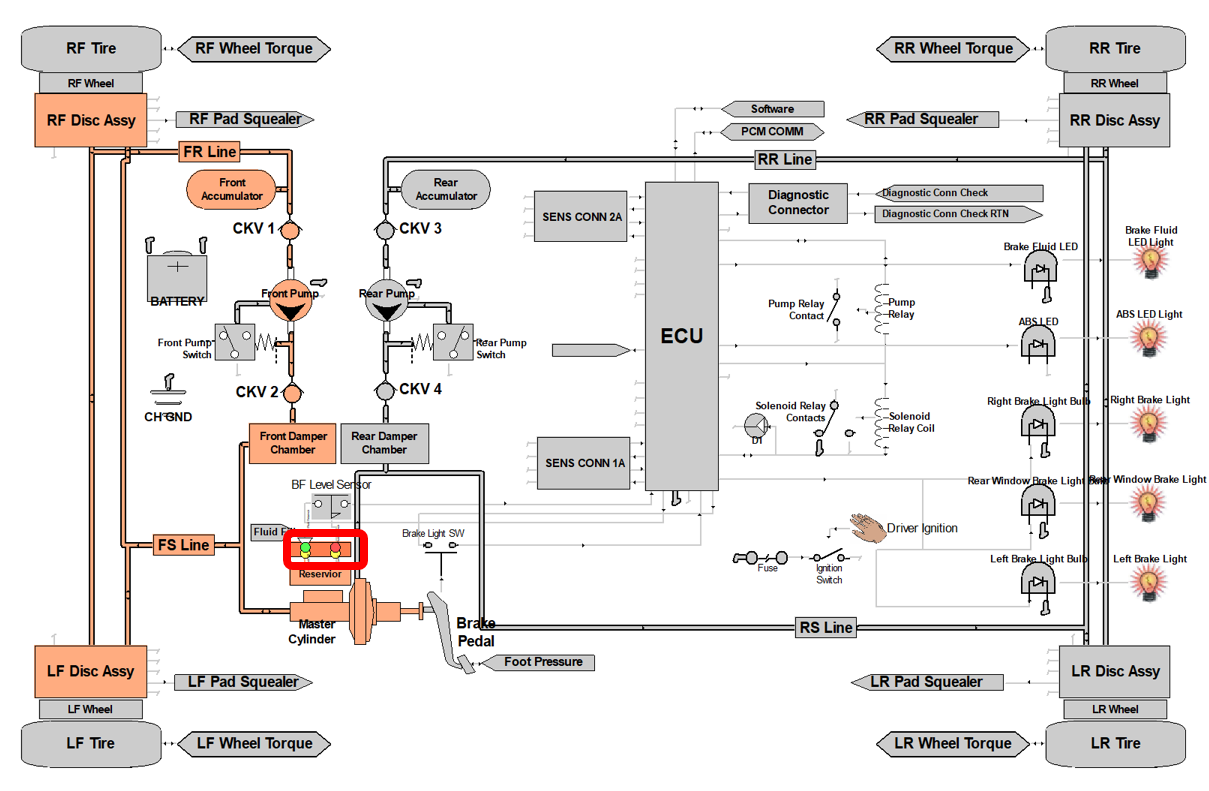
Model view of Feedback Loop
- Allows stepping through entire feedback loop with enhanced color of the current object "Function" in the loop as shown below.