The Desktop Fault Insertion Dialog
The Desktop Fault Insertion dialog has two windows, each of which can display one of several different panels. The side-by-side layout really helps with certain tasks (such as comparing a test sequence used to isolate a given fault with the set of tests that would fail when that fault occurs):
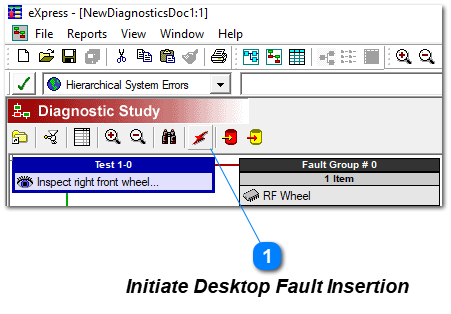
 Initiate Desktop Fault InsertionStarts a Desktop Fault Insertion Sequence using the Desktop Fault Insertion panel shown below. This window appears over the Flow Diagram allowing the Analyst to view the Flow Diagram as the Desktop Fault Insertion Session is run.
|
|
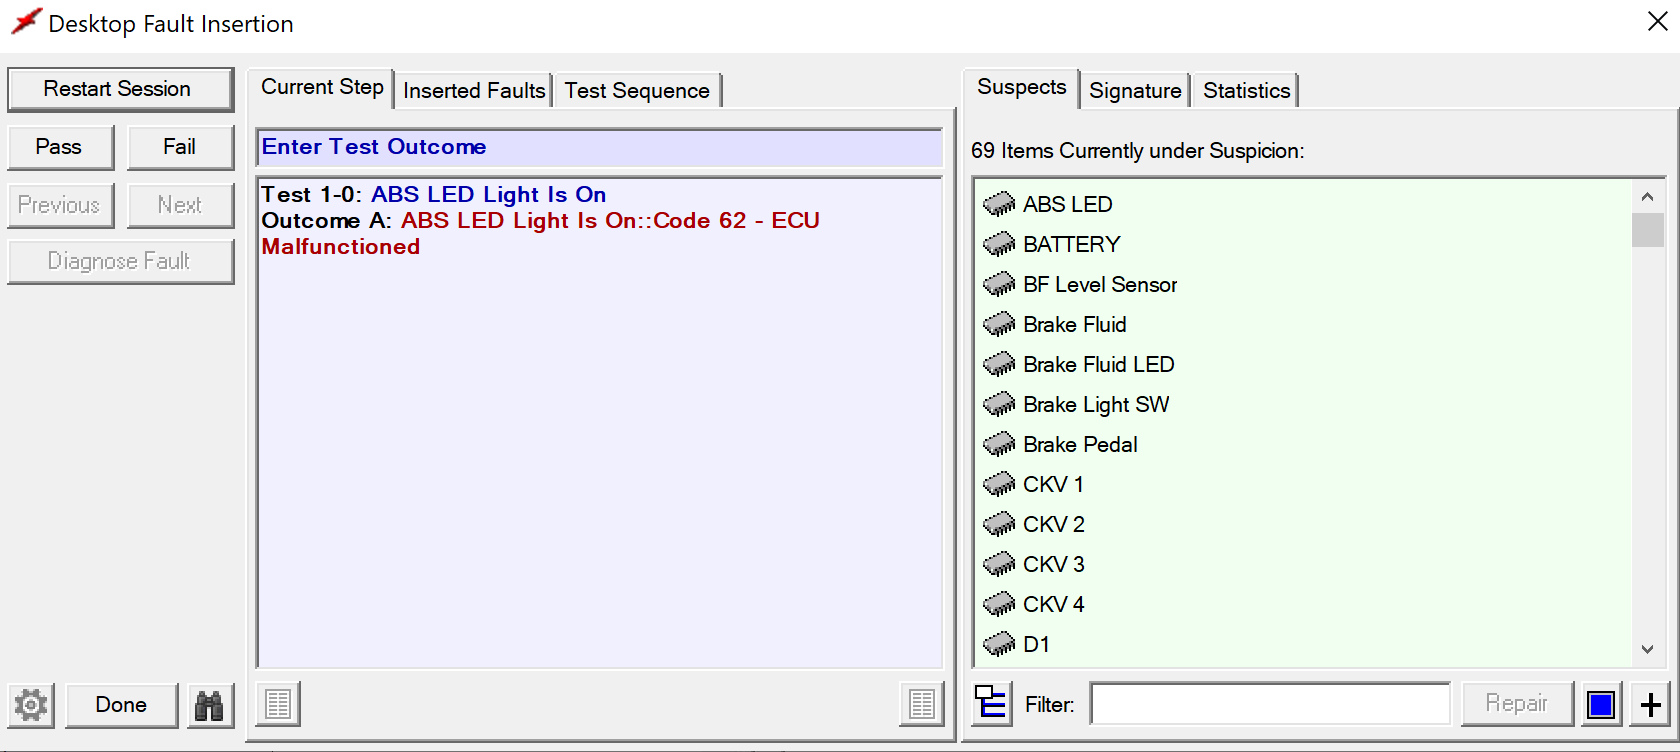
The Test Sequence panel is particularly useful when validating large diagnostic studies (so large that it is not feasible to view isolation sequences in the Diagnostic Flow Diagram window only.). Passed tests are listed in green and failed tests in red. At the bottom of the panel are controls that allow you to control the contents of the window. Here we can see 69 Items are currently under suspision (No sequence has been started so the everything
upstream from the ABS LED is suspect.)
Procedure: Pass causes the Session to move down on the Diagnostic Flow Diagram
Fail causes the Session to move to the right on the Diagnostic Flow Diagram
Previous backs up to the Previous step in the Session
The Signature panel, on the other hand, lists all tests that would fail if the inserted fault(s) were to occur. When no faults are inserted, this panel is empty. It is also empty for faults that cannot be detected using the calculated diagnostics. In the example above, we can see that there are seven tests that would fail for the current inserted fault; as we can see on the Test Sequence panel, however, only two of these tests are actually used by the diagnostics to isolate this fault. At the bottom of the Signature panel is a text filter box (to help you find tests when the list grows long) and a dropbox you can use to control the contents of the window.
On the following sample dialog, we can see that three faults have been inserted:
At the bottom of this panel are a series of buttons that can be used to Insert & Remove faults, generate a Random combination of faults, or Export/Import fault combinations to/from an Excel spreadsheet (or tab-delimited file).
When inserting random faults (a useful feature for performing “gut-check” diagnostic validations), the maximum number of inserted faults is based on a Analyst-defined setting on the Desktop Fault Insertion Options dialog (described later in this notice). When inserting random faults, it is often useful to display the Signature panel on the right—this allows you to quickly identify failures combinations that have no fault signature, having you the trouble of clicking the Diagnose Fault button for faults that you know will be non-detectable.
|
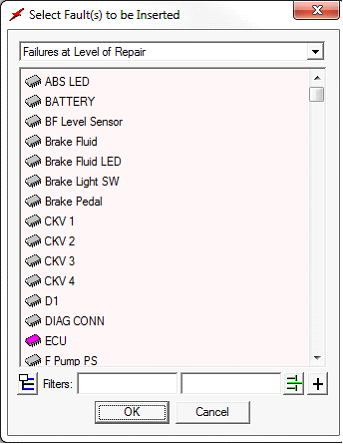
When you click on the Insert button at the bottom of the Inserted Faults panel, the dialog depicted at right—newly redesigned for this version of eXpress—appears. Particularly useful for larger systems are the dual filter boxes at the bottom of the panel, which allow you display all faults that satisfy both criteria.
To the right of these filter boxes is a button that you can use to disable “as-you-type” filtering. When the icon displayed on the button is green, the list will be filtered each time a character is typed (in either box). If you click on this button, the icon will turn gray. Now the filters will not be applied until you click on the background of the displayed list. This is incredibly useful when you are working with very large designs.
|
|
Once you have inserted faults (either randomly, using the selection dialog or having imported them from an Excel spreadsheet), click on the Diagnose Fault button. eXpress will run the diagnostics on the inserted
faults and then jump to the Current Step panel, which will tell you whether or not that fault combination has been correctly isolated. Usually, the faults—if they are detected—will be correcly isolated. There are times, however, when certain failure combinations will “fool” the diagnostics (such as when certain combinations of multiple faults are diagnosed by a strategy that utilizes common cause isolation).
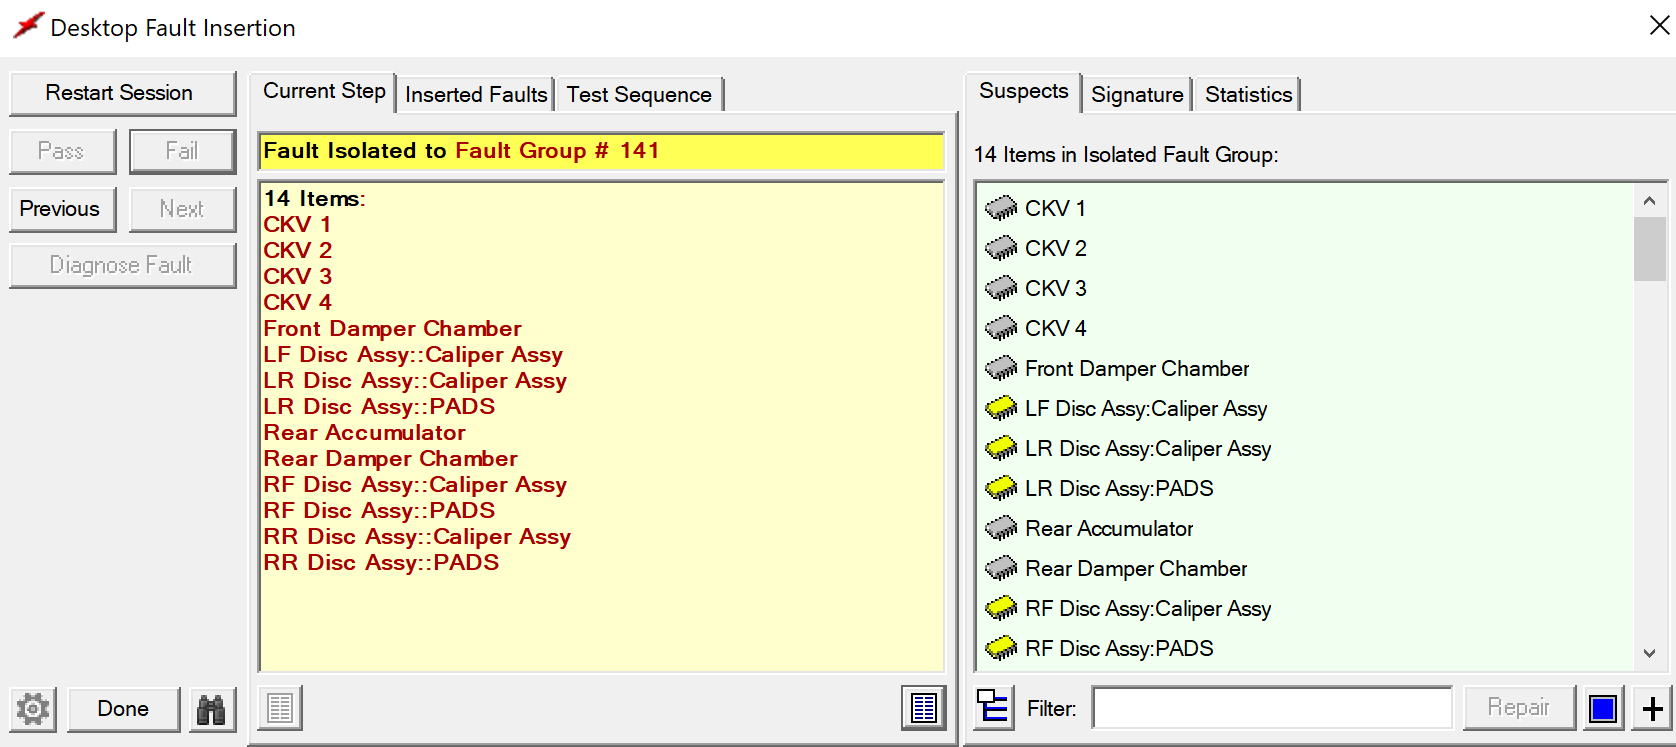
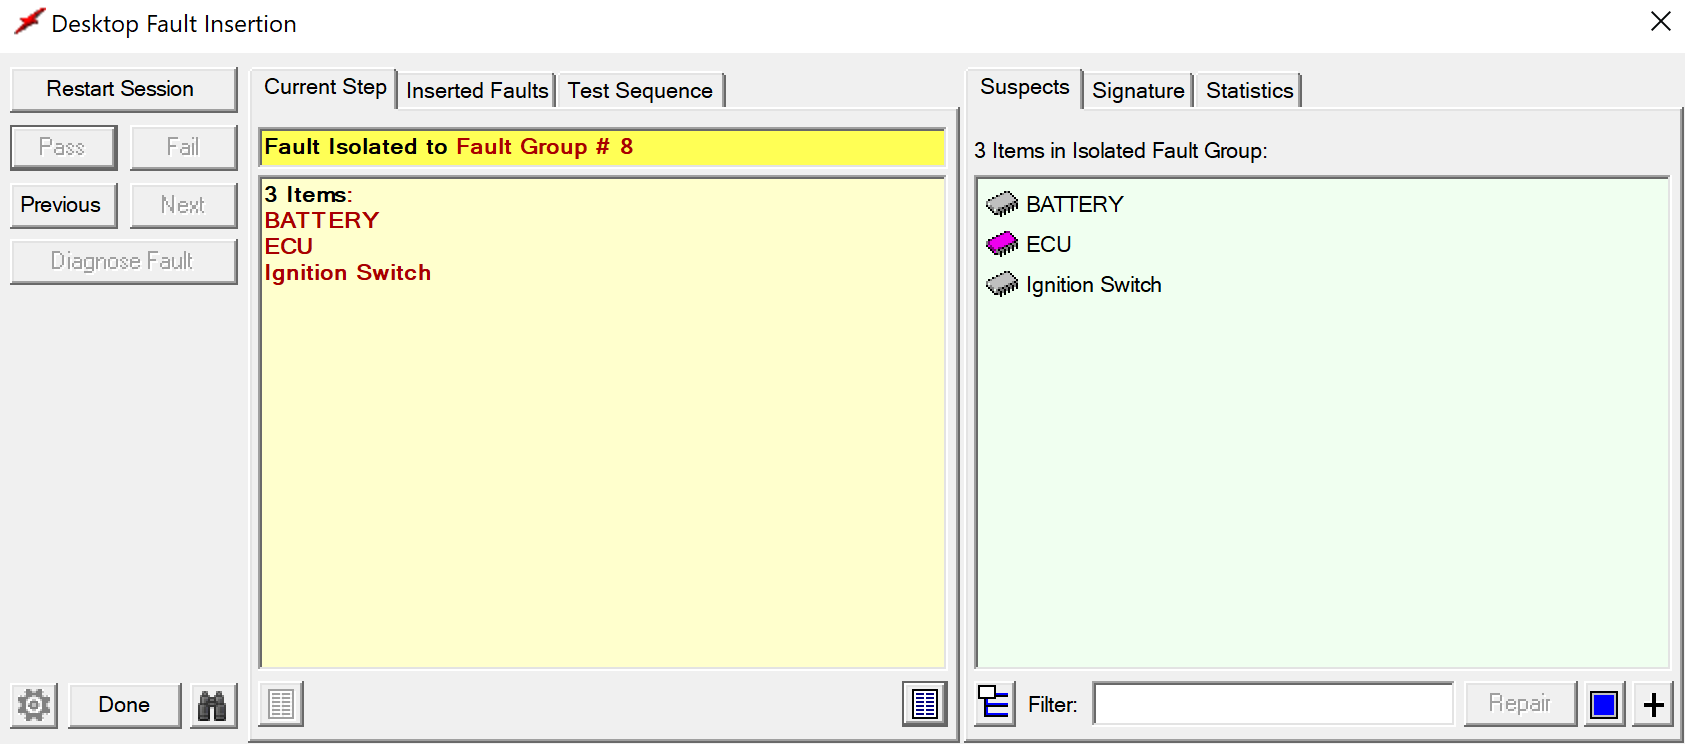
In the example above, the bright green label at the top of the Current Step panel tells us that an inserted fault has been correctly isolated. Other than that, the information that appears on this panel is completely customizable using settings on the Desktop Fault Insertion Options dialog. In this example, the Fault Group ID is listed in the label and the fault group size and isolated repair items are listed in the main window.
Just below this window are buttons that can be used to generate either the Fault Insertion Report or the Fault Group Details Report for the isolated fault group (there is a tool tip for each button, telling you which report is generated by each).
On the right-hand side of the example above you can see the Suspects dialog. Here, this panel lists the specific failure mode that was isolated in Fault Group #15. You will have to expand the item folder to see it, however…or you could click on the icon to the left of the filter box to display the isolated failures directly (without the item folders).
If you choose to step though the isolation sequence one test at a time (using either the Pass/Fail buttons or the Previous/Next buttons), then this panel will display the full set of functions or failure modes that are under suspicion at various points in the fault isolation process. When working with large suspect lists, the filter box provides a great way to investigate whether a given item, function or failure mode is currently under suspicion.
There is also a Repair button—use this to replace the selected items (virtually). If multiple faults have been inserted, you can then click on the Diagnose Fault button to diagnose the next fault.