While there are many extensive purposes for the eXpress modeling tool the main function of the tool is validation of a system design, for its ability to test and identiy faults within the system, provide isolation of these faults to a minimal ambiguity set for repair and also to provide mutiple type reports of the diagnostic capabilities of the system. The Modeling capability of eXpress provides the structure of the system and Diagnostics provide the detection and isolation capability of the system. This section of the eXpress help is provided to aid the Analyst in making the proper setups and options to achieve success in using the diagnostics capabilty of eXpress. The model should be complete and free of errors to have correct results in the Diagnostics.
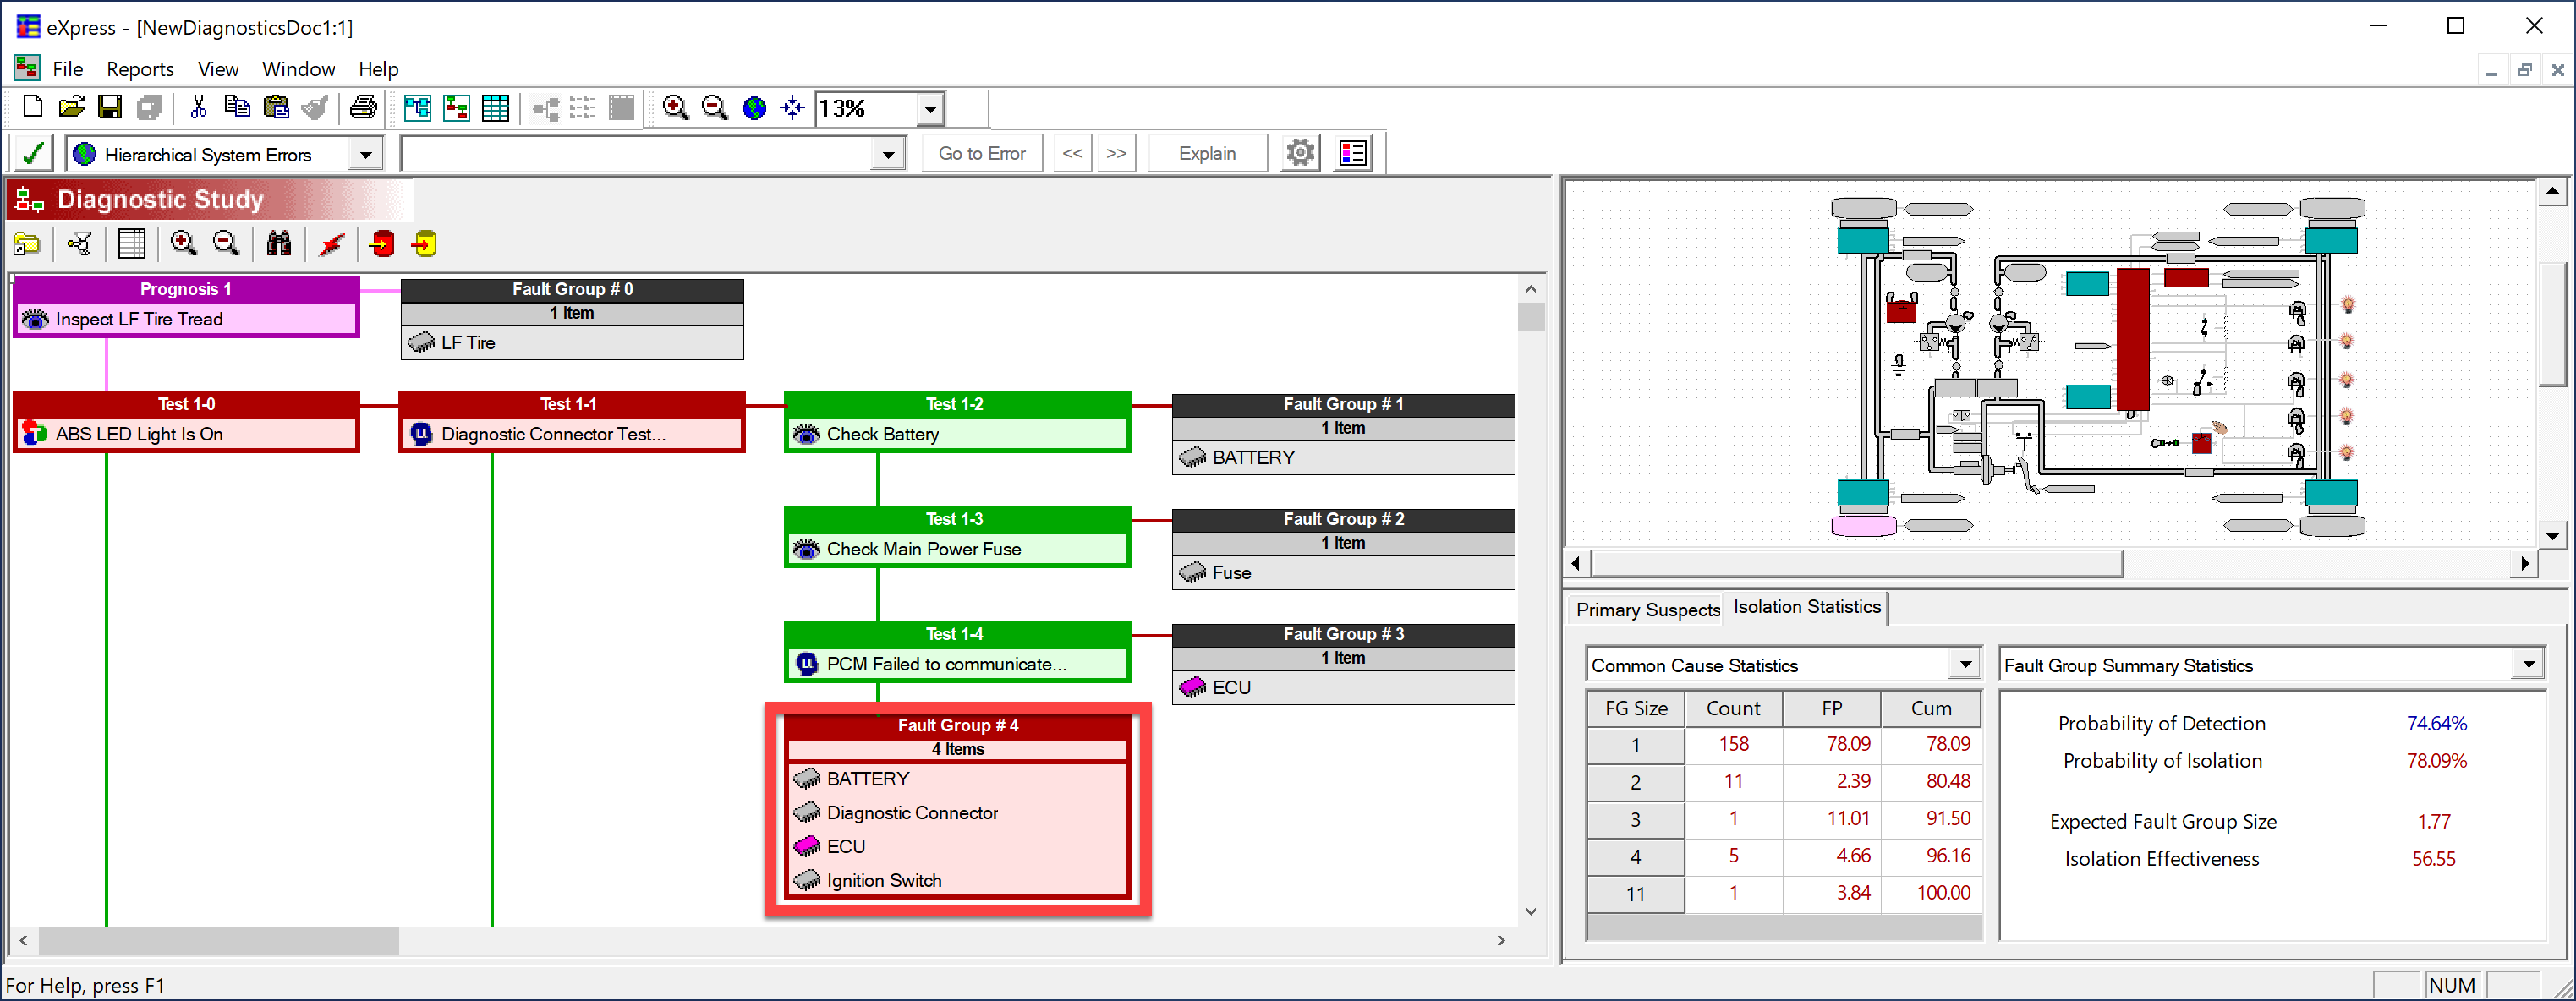
This Icon opens a Diagnostic Study Window shown below as it looks after a diagnostic study has been run. The tree Shown to the left of the diagnostic window is a typical Detection/Isolation tree. Detection consists of the left most vertical blocks each of which represents a detected Ambiguity set. All Blocks to the right of the left most Blocks are the isolation breakdown of the detected ambiguity set into the smallest possible replacement sets.
The Diagnostic Window
Here we see the diagnostic path for the Detection OptionDetect Malfunctions with Fewest Tests (default). Running detection (Test 1-0) for this Algorithm resulted in an Ambiguity of 23 Items which isolation Test 1-1 then split into two ambiguity parts. In the flow diagram coloring is used to show different Isolation results of an Isolation path.
Coloring of the Flow Diagram
Note: The isolation path of interest must be selected to see the coloring
Purple - Prognostic detected Item - Only one prognostic test was choosen for this illustration (Prognosis 1 above)
Dark Red - Detected ambiguity not yet fully isolated (Test 1-0, Test 1-1, and Fault Group #4 above)
Dark Green - Ambiguity decision resulting in ambiguity reduction (Test 1-2,1-3 and 1-4 above)
Black/Grey - isolated item or not in the choosen isolation path
Blue - chosen before Isolation decision test - will remain blue until tested
In the chosen path (Fault Group # 4) we see a detected ambiguity set (Test 1-0) an ambiguity of 23 Items, reduced to 5 items by isolation test 1-1 then isolated (horisontal path) to 3 Size one ambiguities (Fault Groups 1,2,&3) by tests 1-2,1-3,& 1-4 and the selected 4 item ambiguity set (Fault Group #4). This flow diagram shows the best the system can do with the selected tests. Note trhat the Battery and ECU is isolated out in one instance but also part of the ambiguity set of 4. This is because not all function/failure modes of these items can be isolated with the existing tests. The model drawing at right shows the detected items of Test 1-0 with color and the window below gives the statistics of the isolation run. Also note that Fault Group # 4 items (Selected in the flow diagram) are shown in red in the model diagram.
Coloring of the model Diagram
Here too similar coloring is used:
Red - Isolated,
Light red - Portion of Prognostic hierarchical item Isolated,
Dark Green - Items in the original Detection ambiguity now in the remaining vertical detection (Not yet Isolated)
-still in ambiguity with other items
Light Puple - Isolated Prognostic Item
Calculate Fault Groups Flow diagram
Included here also is the flow diagram resulting from running the above algorithm for detection only and then running "Calculate Fault Groups". This Analyst chosen "Study Generate Option" shows the basic Ambiguity sets that detection achieved for the given algorithm chosen. This is included here for information only to show the original 23 items of which only the first 5 were shown isolated out in this illustration. The vertical path from test 1-1 above provides the additional isolations not shown here to isolate these addional 18 items into 19 Ambiguity sets of 2 and 1 additional ambiguity of 4 plus multiple ambiguities of 1. Note the detection of this model was only 74.64% (poor) of which 80.22 % of the detected model was isolated to an ambiguity size of 1 (Very Good).