Feature Description
The eXpress Test Coverage Browser is a powerful new tool for examining and comparing the coverage of one or more tests within an eXpress design. It can be open by the ICON shown below for "all test sets" or as shown to the right for a "specific Test Set"
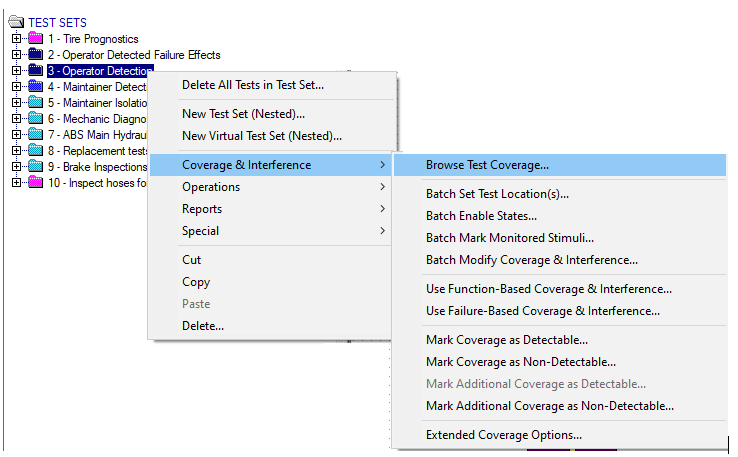
Opening the Browser Test Coverage from the tests sets
OR
Using the Left hand Panel Controls
"Use Open Test Browser ICON"
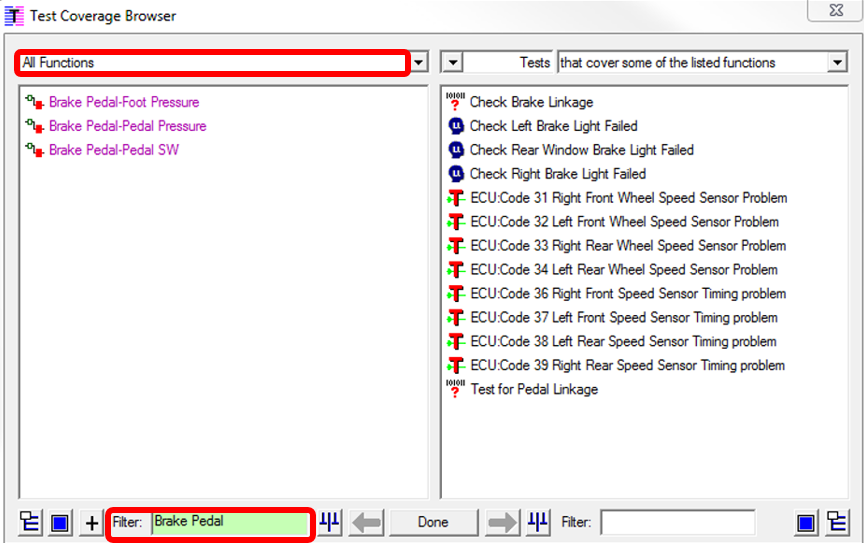
In this example, All Functions was chosen as seen here in the left panel Selection window.
Available Choices are:
In this example, the filter box on the left was used to display "All functions" and filtered with “Brake Pedal” in their abbreviation. Nothing is entered in the filter box for the right-hand window; as a result, we are viewing all tests whose coverage includes one or more of the three functions associated with the brake pedal.
Using the Right hand Panel Controls
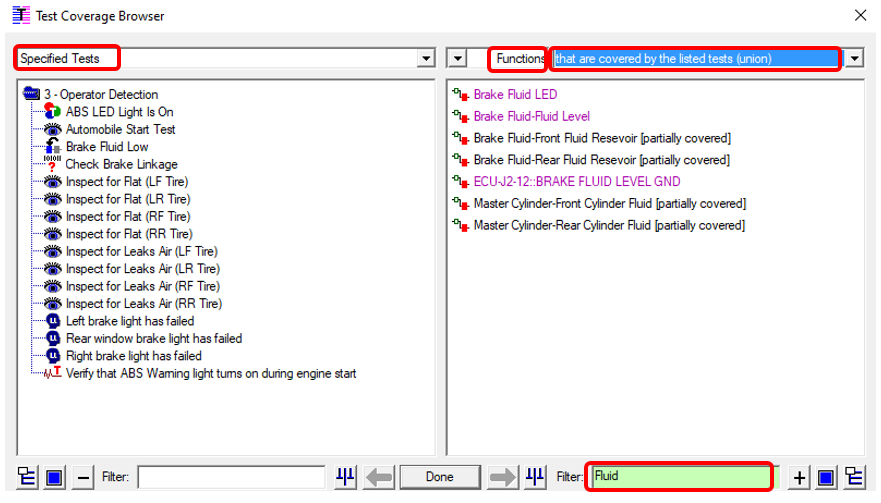
In this example, "Specified Test" (test set "Operator Detection" was chosen as seen here in the left panel Selection window.
with "Function"selected in right window examine type selection window.
Examine possibilities:
and with "That are covered by the listed tests (union)" in the right how covered type window
How Coverage possibilities:
-
That are covered by the listed tests (union),
-
That are covered by the listed tests (intersection)
, -
That are uniquely covered by the listed tests,
-
That are not covered by the listed tests
And Filtered with functions containing the word "Fluid" resulting in 7 test functions being shown that reside in the Operator Detection Test Set that conatin the word Fluid
Note: Magenta colored Tests indicate the test is Hierarchical
NOTE: The possibilities of selections change in the three windows at the top dependent on the choice of the left window:
Following are discussions of possible usages for the Analyst and variations that can help to examine eXpress tests
If the tree on the left is filled with functions or failure modes, then the tree on the right will be populated with tests that cover the selected elements:
In the preceding example, the browser shows all tests that cover the function selected at left. Also, when multiple functions (and/or failure modes) are selected on the left, the browser can be configured to display all tests that cover exactly, some, all, only or none of the selected functions/failure modes.
The scope of the comparisons can be constrained by selecting specific tests, test sets or objects prior to invoking the browser. Alternatively, filters can be applied to one or both of the trees; the browser will then list only elements with a given (checklist) Attribute setting or that are contained within a given Operating Mode. Using filters, for example, the browser can be used to explore how well mission-critical functions are covered by various tests.
When one or more entries are selected in the tree on the right, the button depicting a right arrow (located at the bottom of the dialog) can be used to set up a new browsing based on the selected elements. This provides an easy way to create complex queries (such as all tests that cover elements that are not covered by tests in a given test set). If, for the example above, the right-arrow button were to be clicked, the tree on the left would be filled with the elements that had been previously selected on the right:
The comparison method can then be changed for the new browsing (here, the default comparison was changed to display functions that are covered by all tests listed on the left). To return to the previous browsing, simply click on the icon depicting a blue left-arrow.
Finally, editing short-cuts can be found by right-clicking on selected elements in the two trees. These short cuts can transfer control directly to the editing panel for a specified output function or failure mode, invoke the test editing mode for a specified test, or exit directly to Grid View (populating the grid with selected tests, objects, functions or failure modes). If, after editing, the Test Coverage Browser is again invoked, a prompt will appear asking whether to resume the previous browsing session (with all settings intact) or to start a new browsing session based on the current selections.