Multiple-Outcome Tests Overview
Feature Description
An enhancement to eXpress is the ability to define tests with three or more outcomes. A multiple-outcome test is a special type of group test in which each of the grouped subtests represents a different way in which a test can fail. So, when we say Multiple Outcomes, we really mean Multiple Failure Outcomes (if you count the “Pass” outcome on each test, then eXpress has always handled two outcomes per test).
How to designsate a group test a Multiple-Outcome test:
|
An existing group test can be converted into a multiple- outcome test using a new option on that test’s Test Interpretation panel:
|
|
3 choices to make:
|
1
|
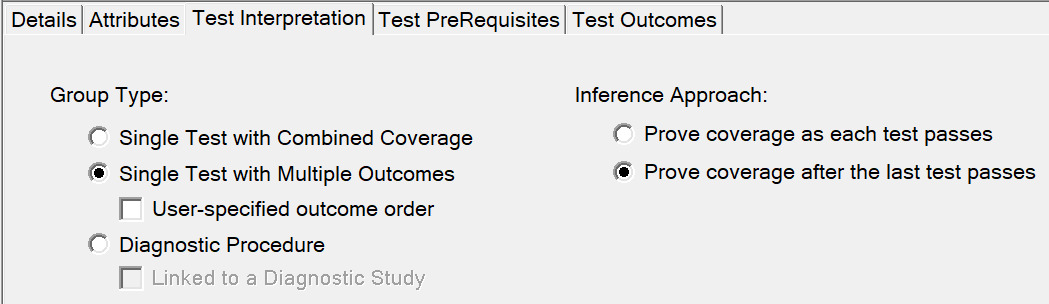
For all existing group tests, the Group Type default will be set to “Single Test with Combined Coverage”. To designate that a group test constitutes a multiple-outcome test, select “Single Test with Multiple Outcomes” as the Group Type. (This option, along with all the other settings on this panel, can also be edited in Grid View.)
|
|
2
|
You can also specify the Inference Approach to be used as outcomes of this test are evaluated by the diagnostics. The default is “Prove coverage after the last test passes”, which means that each subtest (outcome) for this group will be used to detect failures, but the coverage for the entire group test will not be “proven” good until the final subtest (outcome) passes. You can also opt to “Prove coverage as each test passes”; diagnostic knowledge will then be inferred as each outcome is considered (and ruled out), thereby reducing the effective coverage of subsequent outcomes.
|
|
3
|
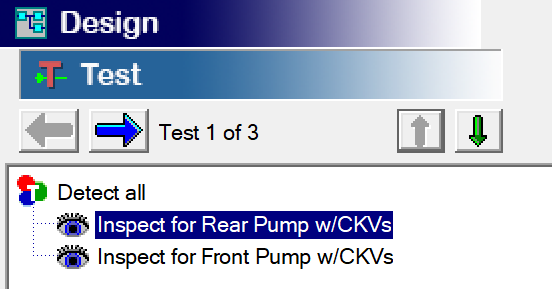
You can specify the order in which outcomes are evaluated by the diagnostics. During diagnostics, test outcomes are presented in the same order in which the subtests are listed within the group test—which, by default, is based on the alphanumeric sort used throughout eXpress. If, however, you enable the “User-specified outcome order” checkbox on the Test Interpretation panel, then two new icons (depicting up and down arrows) will appear at the top of the Explorer Tree when you edit that group test.
|
|
Use these green arrows to move subtests up and down within the group. These icons will only appear for multiple-outcome tests that have been set up to utilize a “User-specified outcome order” (also, these icons will only be enabled when you click on one or more of the tests within the group).
When you calculate diagnostics in an eXpress diagnostic study, the outcomes will be evaluated (and displayed) in the order specified within the group.
|
|
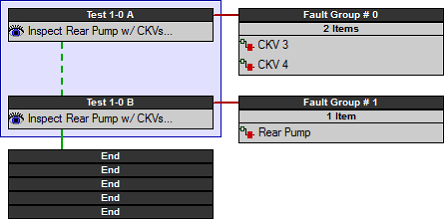
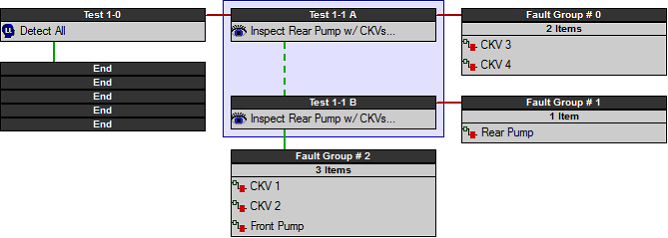
The following two Diagnostic Flow Diagrams show this same multiple-outcome test used for fault detection (Case 1) and fault isolation (Case 2).
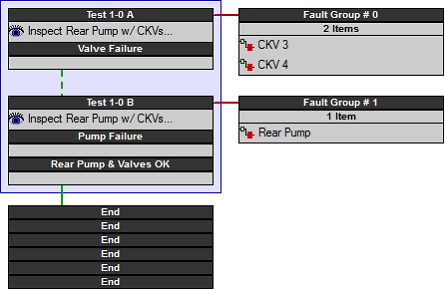
In the Diagnostic Flow Diagram, the different outcomes of a multiple-outcome test are listed vertically and surrounded by a light blue box. In the examples above, the green dotted line connecting the two outcomes indicates that nothing is proven good after the first outcome—as dictated by the “Prove coverage after the last test passes” setting on the Test Interpretation panel for that multiple-outcome group test. If the Inference approach had been set to “Prove coverage after each test passes”, then the two outcomes would be connected by a solid green line.
Within the Diagnostic Flow Diagram, the same numerical identifier is used for all outcomes of a single test; sequential letters (starting with ‘A’) are appended to each outcome, however, so that each node in the tree still has a unique ID. So, in the example at left, the nodes for the detection test are labeled Test 1-0 A and Test 1-0 B (likewise, in the example at right, the nodes are labeled Test 1-1 A and Test 1-1 B).
Although not shown in the examples above, the test names within each cell are also different for each outcome—the name of the subtest (outcome) is appended to the name of the multiple- outcome group test. When you click on one of these cells you can see the full test name on the active panel. You can also opt to generate the tree with a wider cell size, although this will result in a less efficient use of space. Perhaps the best way to avoid this conflict between clarity and efficiency is to define labels for each outcome (subtest) and then include these labels in the Diagnostic Flow Diagram.
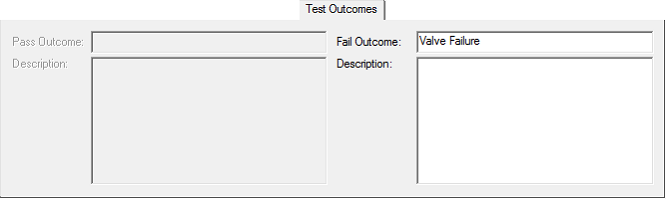
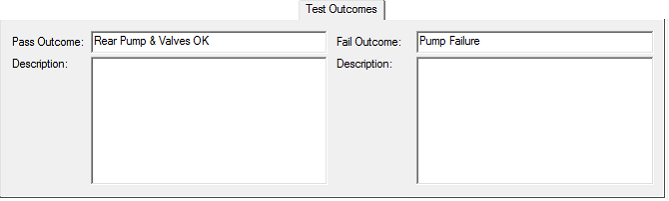
eXpress has allowed you to define outcome descriptions for some time now. This is done using the Test Outcomes panel that appears during test editing. In this version of eXpress, we have added a small label field that can be defined for each outcome (in addition to the more lengthy description field). The following two images show the Test Outcomes panel for each outcome of the test we have been using in this example:
Notice that, for the first outcome, the Pass Outcome label and description have been disabled. The pass outcome will always be associated with the last outcome evaluated by the diagnostics. Since, for this example, outcomes are evaluated in a Analyst-specified order, a Pass Outcome need only be entered for the last subtest within the group. Fail Outcome labels, however, have been assigned to each subtest.
When you opt to include test outcome data in the Diagnostic Flow Diagram, the define outcome labels replace the “Fail Outcome”/”Pass Outcome” headers within each test cell. (Note: if you have never created included outcome descriptions in the DFD, you can do so by clicking on the “Flow Diagram Options” tab on the Study Generate Options dialog and the selecting the preset configuration “Diagnostic Flow Diagram with Test Outcomes”).
|
|
For multiple-outcome tests, the pass label (“Rear Pump & Valves OK”) only appears in the cell for final outcome of that test. Each outcome node, however, has its own fail label (“Valve Failure” and “Pump Failure”).
|
In addition to the Test Outcome panel, test outcome labels can be edited in Grid View or imported using the Spreadsheet Attribute Import (in the same manner as outcome descriptions have been able to be imported in previous versions of eXpress).
Multiple-Outcome group tests can be useful when multiple sensors are used in a voting scheme to determine if a component has truly failed. For example, three sensors that monitor fluid flow are used to determine if a pump output is still working. If one sensor fails, the two remaining sensors indicate a "good" output and thus "vote" that the pump is still operational.
Key points to remember for Multiple-Outcome Tests:
-
The tests outcomes are assumed to be mutually exclusive
-
Subsequent isolation tests are not impacted
-
The test is exported to DiagML as one test in a single diagnostic procedure.