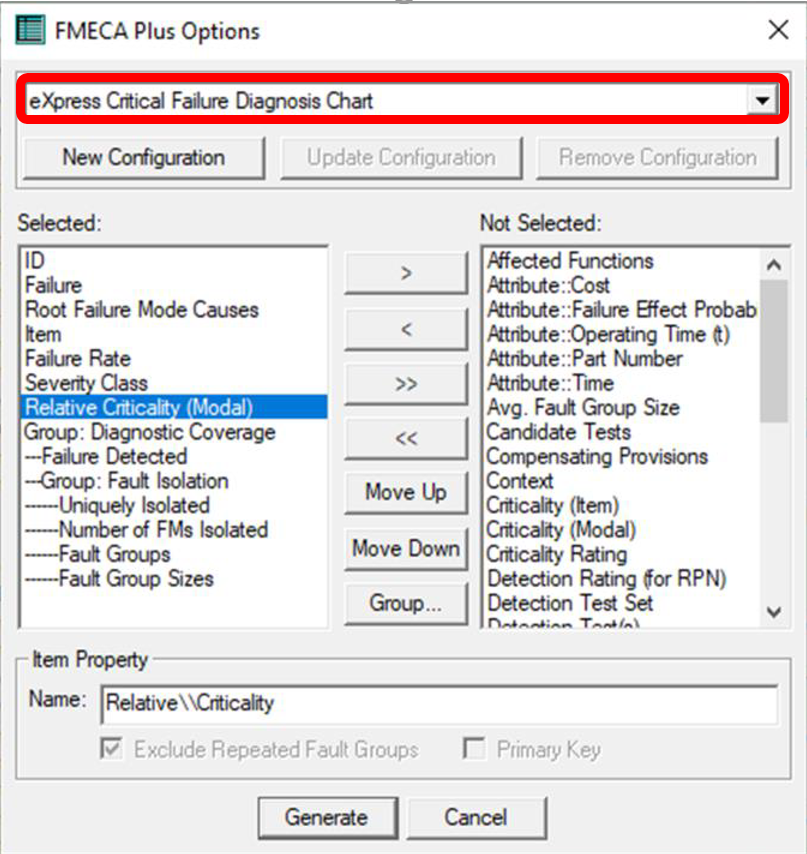
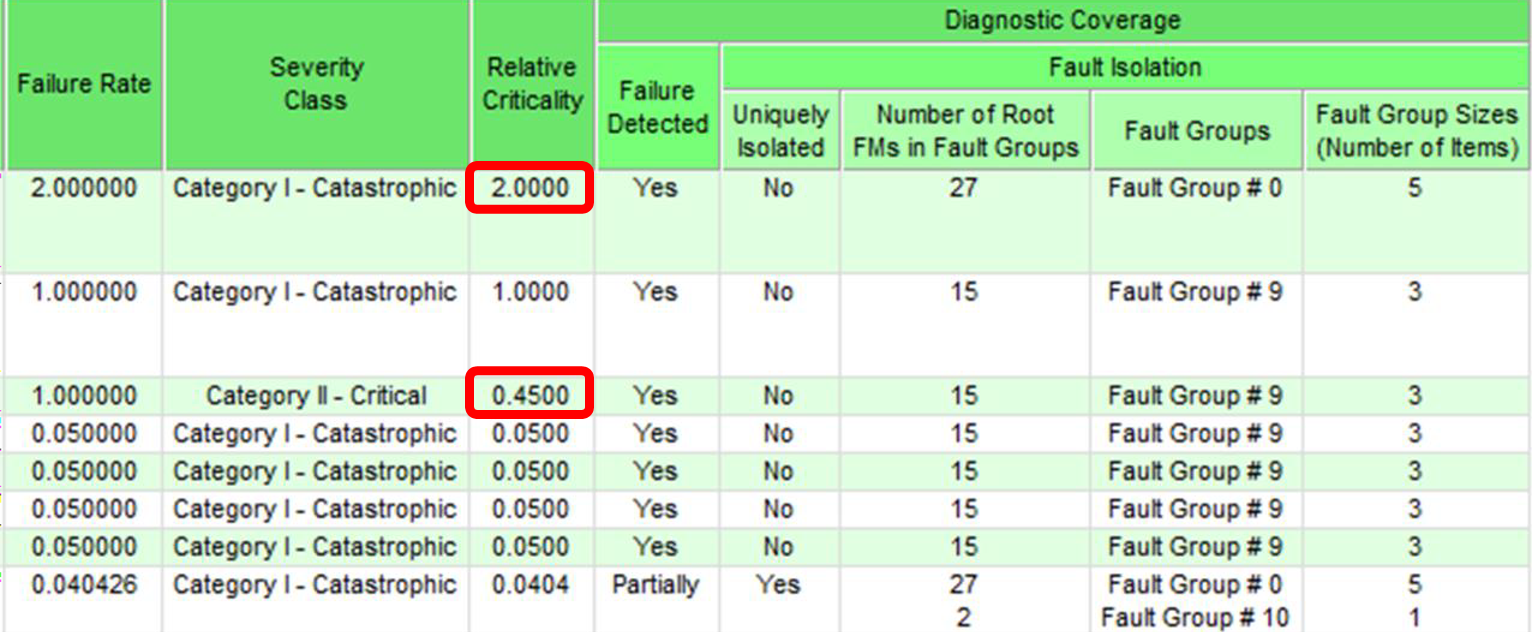
The relative criticality appears not only in the Criticality Report, but also in the pre-defined FMECA Plus format “eXpress Critical Failure Diagnosis Chart”. This chart shows how well each failure is handled by the diagnostics—not only in terms of fault detection, but also the size of the fault group(s) to which that failure can be isolated, and whether the failure can be uniquely isolated. Because this chart is sorted by Relative Criticality, it provides an excellent means of verifying that all critical failures are adequately addressed within the diagnostics.
The column setup for the “eXpress Critical Failure Diagnostic Chart” is shown at left.
Notice that the “Relative Criticality (Modal)” column is included in this format. Although this column can be added to any chart generated by FMECA Plus, only in this chart will the rows be sorted by the Test limits in this column.
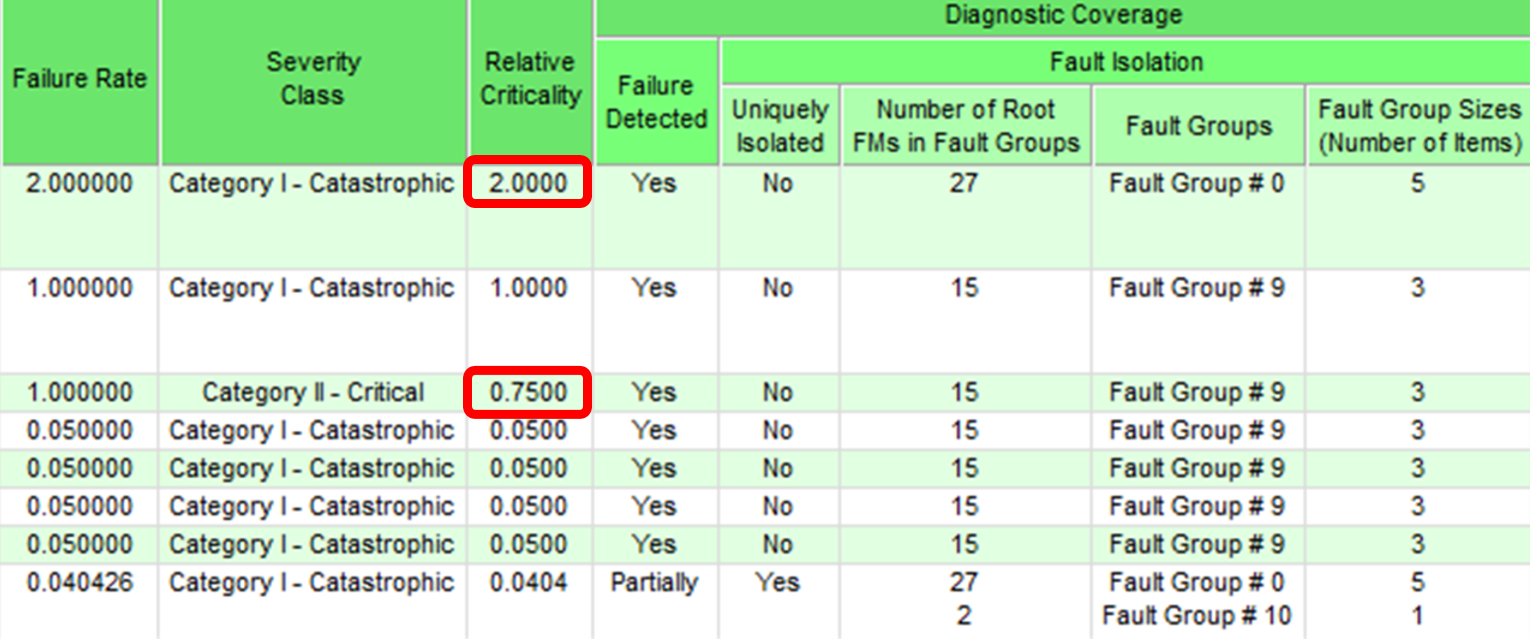
The sample below shows the right-most
columns from the “eXpress Critical Failure Diagnosis Chart”.
For this chart, the severity classes were defined using the Severity checklist attribute (described earlier in this document) that is applied to all eXpress models by default. This attribute, remember, has an entry for each severity level defined within MIL-STD-1629A. The Test limits 1-4 are assigned to these classes in ascending order so that the most severe category (“Category I – Catastrophic”) is assigned 4, etc.
The relative criticality has been calculated by multiplying the failure rate by a percentage based on the severity class. Because in this example there are four severity classes, the corresponding percentages are 25%, 50%, 75% and 100%. So, in this example, the relative criticality for “catastrophic” failures is 100% of the failure rate; for “critical” failures, it is 75% of the failure rate, etc.
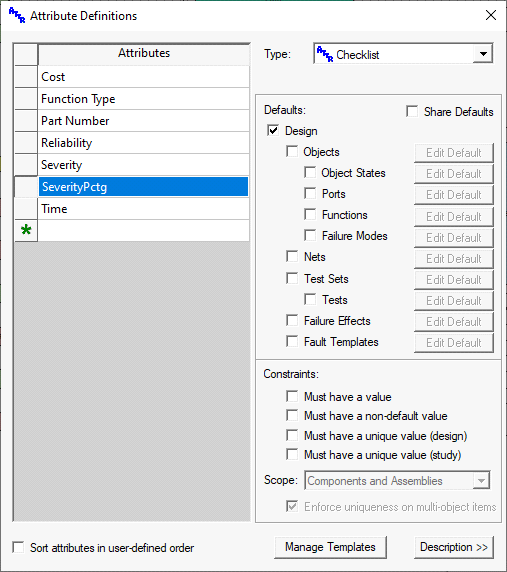
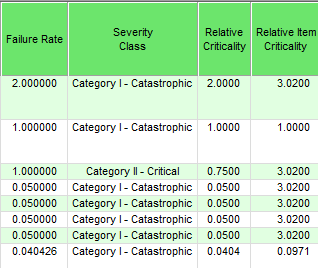
The easiest way to override these percentages is to create a “SeverityPctg” attribute. This checklist attribute must be defined at the
design level, must be marked as “mutually exclusive” and must have assigned Test limits.
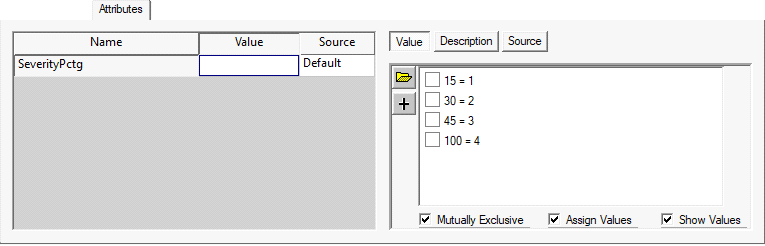
Create an entry for each desired percentage and assign as a Test limit the minimum Test limit from the severity attribute that you would like to map to that percentage.
In this example, “Critical” failures (which are assigned the Test limit 3 in the Severity attribute) will result in the failure rate being multiplied by 45% during the calculation of relative criticality.
In the example below you can see that, for “catastrophic” failures, the relative criticality is still 100% of the failure rate. For “critical failures”, however, the relative criticality is now 45% of the failure rate.
The severity percentage mapping mechanism provides a way of modifying relative criticality calculations by modifying a single attribute definition at the level of the design where the FMECA chart is generated.
Similar to the “Item Criticality” column, the “Item Relative Criticality” column can be added to any FMECA. This column contains the sum of the relative criticalities for all failures associated with the same item as the given failure.
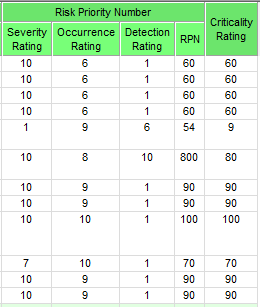
Criticality Rating
The “Criticality Rating” column within FMECA Plus is a rating of 1 to 100 that is calculated by multiplying the Test limits in the severity and occurrence rating columns. This is essentially the same calculation that is used for the Risk Priority Number when a FMECA study is not linked to a diagnostic study.
The FMECA columns depicted at right show the RPN and Criticality Rating columns side-by-side. When the Detection Rating is 1, the RPN and Criticality Rating are identical.
Non-detected (or partially-detected) failures, however, do not impact the Criticality Rating, since it is calculated as the product of the severity and occurrence ratings.