
Products
Maintainability Engineering
Fault Isolation Report Statistics for Maintainability
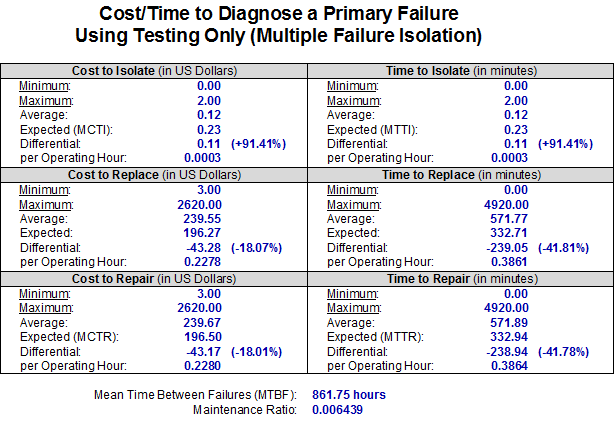
The eXpress Fault Isolation Report has several metrics that are useful in determining the maintainability of a system. Maintainability metrics in this report include minimum, maximum, average and expected time and cost to repair the system. Industry wide metrics such as mean time to repair (MTTR), mean cost to repair (MCTR) and mean time between failure (MTBF) are found on this report. Comparisons can be made between different diagnostic strategies to determine how the MTTR, MCTR and MTBF are affected by selecting different test candidates, algorithms and weightings in the calculation of the diagnostic strategies.
The Maintenance Ratio metric, which appears in the Isolation Cost and Time Statistics section of the Fault Isolation Report, is a measure of the maintenance manpower burden required to maintain a system and is calculated by dividing the MTTR by the MTBF.
A metric which is unique to the eXpress Fault Isolation Report is the differential between the average and expected mean times and mean costs. This differential examines how well the diagnostic design is doing in separating the items which have a high repair time or repair cost from the items that fail frequently.

Maintenance Metrics for Regular Fault Isolation
The Fault Isolation Report may include metrics to indicate how well the diagnostics will resolve a failure when serial replacement is used. Using serial replacement, the technician would replace the most likely failures in a fault group first and then retest between each replacement. The fault resolution statistics then show both how long it takes to replace each component and how long it takes to retest after each replacement.

Maintenance Metrics using Lamba Search (Serial Replacement)
Using the Fault Group Rankings Report to Improve the Design.
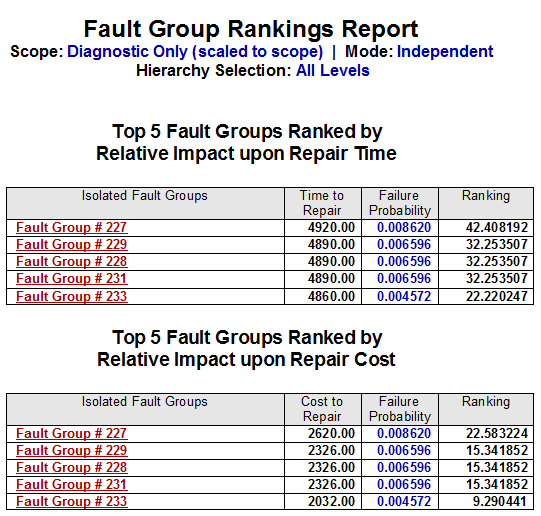
The fault group rankings report lists the fault groups which will have the greatest impact upon both repair cost and repair time if they were broken up into smaller fault groups.

Fault Group Rankings report with only the top 5 candidates showing.


