
Products
Diagnostics-Informed Fault Tree Analysis
The eXpress FTA Module
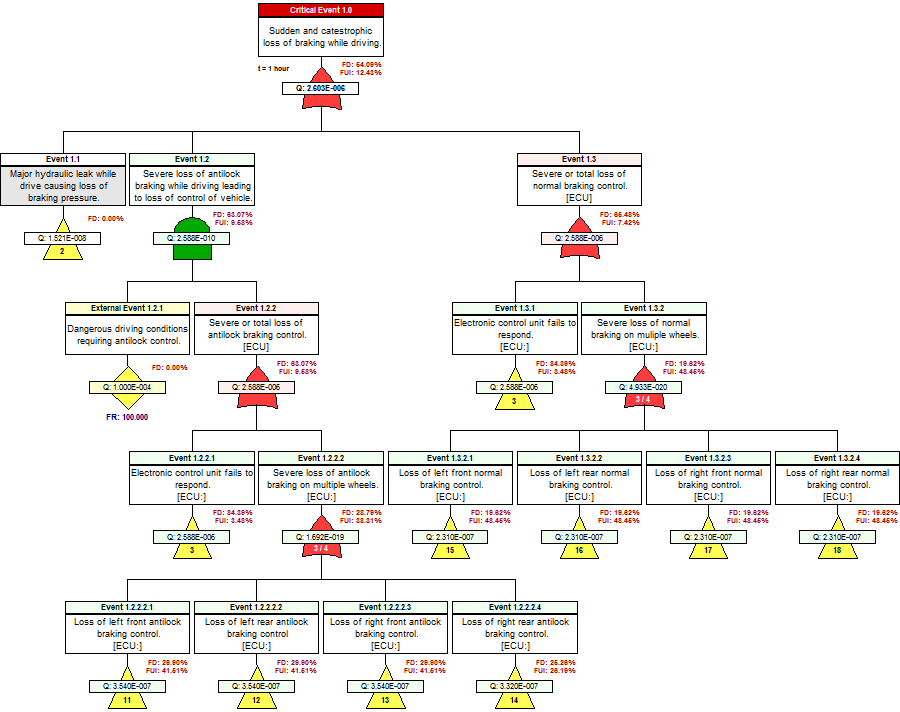
The optional eXpress FTA Module automatically generates full-featured fault trees using data from an eXpress systems engineering model. Fully integrated with both FMECA Plus and the eXpress diagnostics/prognostics, the resulting Fault Tree Analysis not only opens up new vistas within the realm of Diagnostic Engineering, but also provides for the dovetailing of previously independent efforts expended on Diagnostic, Reliability, Risk and Safety analysis.

eXpress Fault Tree Analysis Integrated with Diagnostics, Prognostics and Failure Analysis (FMEA)
Customized Automation
Although fault trees are generated automatically within eXpress , there are many ways to customize their content, order, layout and appearance. This unique blend of customization and automation greatly reduces the level of effort required to create deliverable-quality fault trees – trees that have been specifically tailored to suit your particular analysis needs.
Integration with eXpress Models
Because eXpress captures engineering data at a depth lower than is necessary for most FTA efforts, the failure rates for primary failures in eXpress fault trees are automatically derived from the same data used for other design analysis efforts. Even preliminary design data, when represented as a so-called “inverted FMEA”, provides an excellent framework that can serve as a functional roadmap of the system hierarchy. The propagation of failure represented in this roadmap can then be studied and updated for use in the final Fault Tree Analysis.
Integration with eXpress Diagnostics
Because fault trees in eXpress are generated from the same data that is used for diagnostic engineering, cross-disciplinary guesswork is virtually eliminated. Reliability, Risk & Safety analysis can now confidently take into account the behavior of the actual diagnostics that will be fielded with the system. This reveals new areas of risk that result when diagnostics are unable to adequately identify or isolate the root causes that lead to critical failure. Likewise, diagnostic engineers can now take advantage of the in-depth analysis of failure performed by other disciplines. Diagnostic effectiveness can be assessed from an operational standpoint (thereby transcending the so-called “maintenance bias” that inheres in most diagnostic analysis efforts).
Accounting for Prognostics
When an eXpress FTA is linked to a diagnostic study that includes prognostic definitions, the expected decrease in the occurrence of failures that can be prevented using prognostics will be reflected in the fault tree (with failure rates reduced based on the specified confidence of each prognosis).
Fault Insertion
A useful feature of the eXpress FTA is the ability to assess the impact of individual failures (or sets of failures) by inserting faults and viewing the propagated effects within the fault tree. The tool’s Fault Insertion capability also allows you to visually identify single points of failure—failures that, if they were to occur, would directly result in the top-level event.
Reports
The eXpress FTA module offers a variety of user-customizable reports, each relating to a different aspect of Fault Tree Analysis. These reports have been designed to address key concerns for a variety of disciplines, including (but not limited to) Reliability Analysis, System Safety Analysis, Probabilistic Risk Assessment and Diagnostic Engineering. All reports created by the eXpress FTA module can be generated as RTF documents, exported as Excel spreadsheets, or saved in XML format.
Cut Set Details Report
The Cut Set Details Report provides detailed information about each of the minimal cut sets for a given fault tree. The report can be generated as a list of cut sets (shown at left) or as a list showing the different cut sets associated with each primary failure. With user-selectable columns, sorting, grouping and filters, this report is likely to be essential to all FTA efforts.
Failure Mitigation Report
The Failure Mitigation Report shows, for each primary failure, the extent to which that failure is mitigated by functional redundancy (or some other design consideration) to prevent it from acting as a single point of failure.<.p>
Importance Measures Report
The Importance Measures Report lists standard industry measures of the importance of various elements to the successful performance of a given device or system. These metrics (some of which are shown at right) are staples of Probabilistic Risk and Safety Assessments (PRA & PSA).
Probability of Failure Report
The Probability of Failure Report lists the likelihoods of critical failure, “partial” failure (Fail Safe) or no failure in columns colored red, yellow & green. Probabilities are calculated for minimal cut sets or for individual failures, showing how they collectively result in the critical event’s overall probability of failure. An optional summary lists the overall probabilities for each fault tree in a single table.
Failure Diagnosis and Prognosis Report
The Failure Diagnosis and Prognosis Report shows, for each primary failure whether the failure is detected, prognosed and uniquely isolated to a single failure.


